

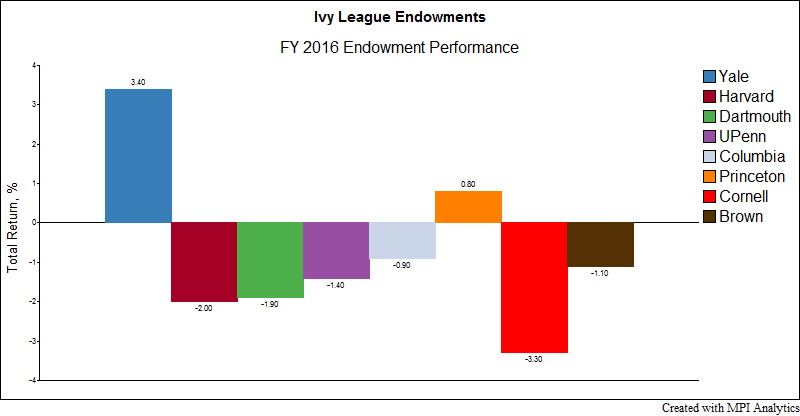
Yale’s unprecedented domination of the 2016 intra-mural contest over endowment investment returns bears all the earmarks of an autumn classic. The performance is all the more noteworthy when contrasted with that of arch-rival Harvard’s endowment, whose disappointing $2 billion drop in value is likely to both limit funding for University programming and, noted President Drew Faust, prompt a reconsideration of Harvard Management Company’s entire investment strategy.
Based on our endowment study last year, we decided to take a closer look at Ivy League endowment performance in 2016.
The set of regression factors or “factor map” used in our analysis 1 is comprised of the following indices corresponding to a generalized set of endowment exposures:
| Foreign Public Equity | MSCI EAFE ND Index |
| U.S. Public Equity | S&P 500 Index |
| Real Estate | Cambridge Associates Real Estate Index |
| Non-public Equity | Cambridge Associates US Private Equity Index, Cambridge Associates US Venture Capital Index2 |
| Commodities/Real Assets | Bloomberg Commodity Index |
| Bonds and Cash | Barclays Aggregated Bond Index |
| Emerging Market Equities | MSCI EM ND |
| Hedge Funds | Eurekahedge 50 Index 3 |
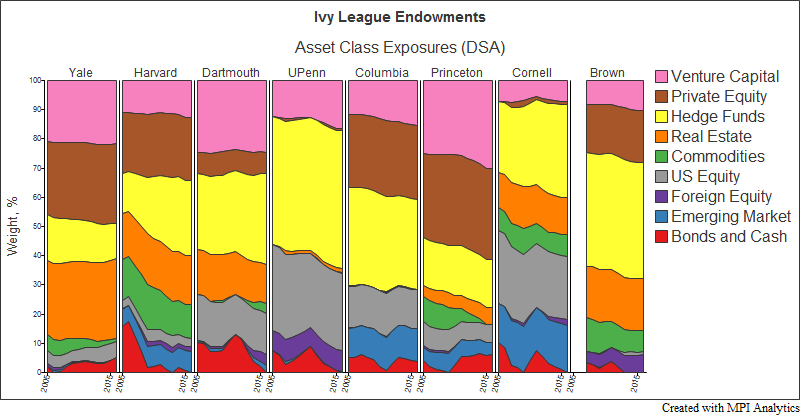
Above we present the effective exposures of the Ivy League endowments. These are not actual holdings but rather the results of our analysis using MPI’s proprietary DSA analysis.
Below is the 2016 performance attribution composed of the returns attributable to each endowment’s allocation exposure to different asset classes as well as a selection return representing those returns not attributable to factor exposures.
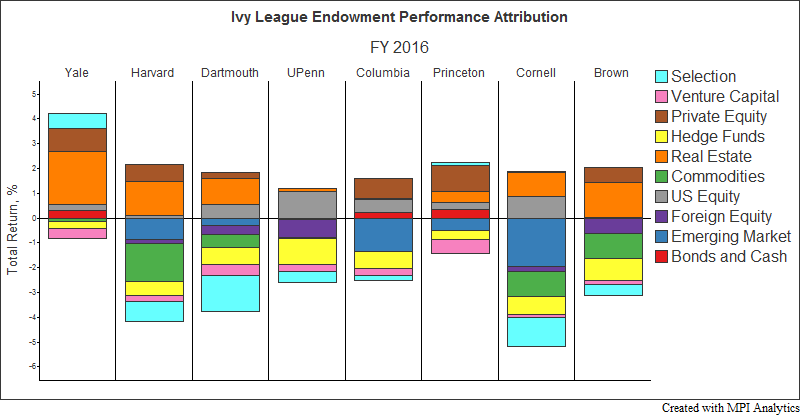
Reprising performance results from recent years, Yale’s FY2016 best-in-class performance can be attributed to four themes: a focus on alternatives, strong emphasis on asset allocation, including negligible exposure to commodities and commodity related markets, and positive returns arising from manager selection. In fact, Yale has the largest positive selection return — roughly 0.6%.
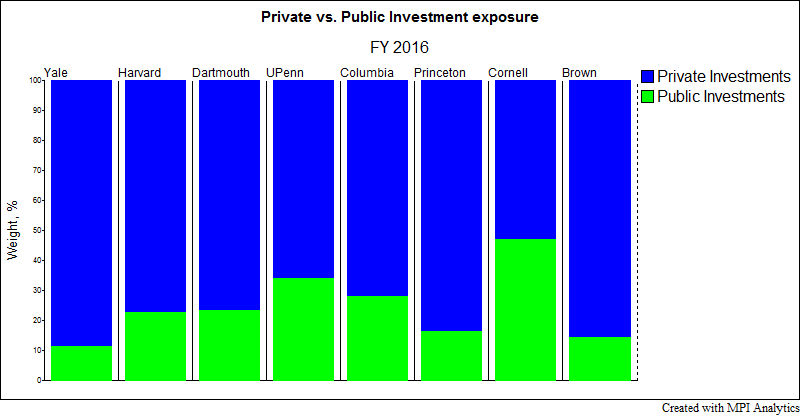
Yale’s overweighting of Private Investments (including Hedge Funds, Private Equity, Venture Capital and Real Estate) is among its most noteworthy attributes. Its portfolio showed an 11% exposure to Public Investments vs. a 20% exposure for Harvard. Strong emphasis on alternative assets has been a hallmark of the widely adopted “Yale model” popularized in a recent book by one of its pioneers – Yale endowment manager David Swenson.
Yale’s 2016 asset class exposures were more beneficially balanced among Private Investments relative to their peers, thanks to greater exposure to Private Equity and Real Estate than to Hedge Fund and Venture Capital. Within Yale’s substantially smaller exposure to Public Markets, it overweighed US equity and Bonds relative to Commodities and Emerging Market Equities.
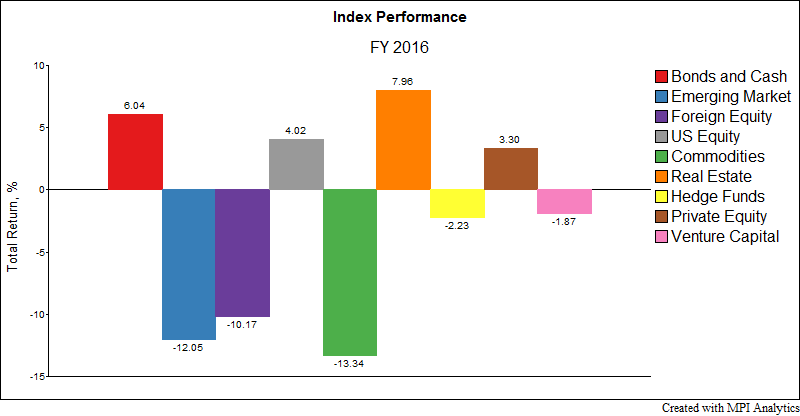
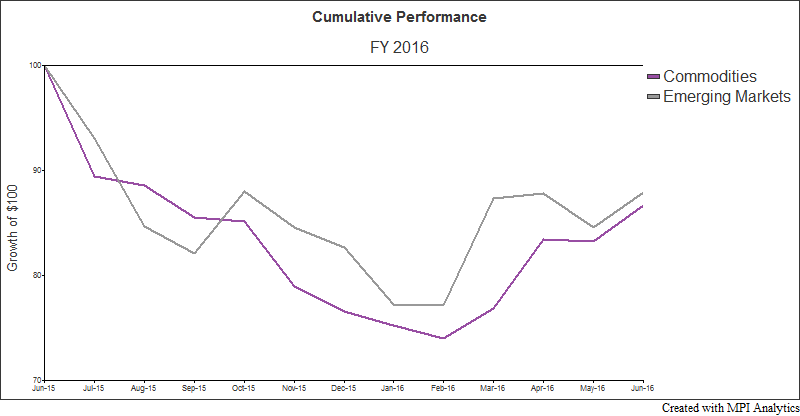
As the above graph of FY2016 asset-class returns depicts, Yale’s decisive underweighting of Commodity and Emerging Market exposures was a major source of its outperformance. Thanks to declining oil prices, commodity markets fell dramatically during FY 2016, dragging down Emerging Market Equities, a number of which endured political turmoil that contributed to significant year-over-year losses. Harvard and Cornell, which showed the largest exposures to these two asset classes, recorded the lowest returns in the group.
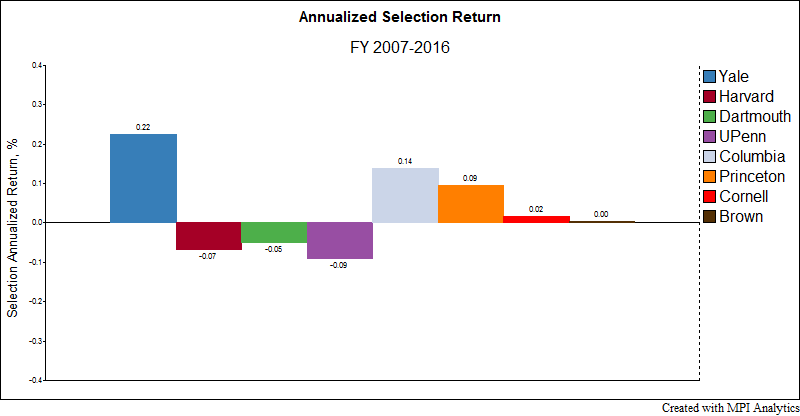
Finally, Yale’s Selection Return of 0.6%, alongside that of Princeton, displayed the only positive unexplained performance among the Ivy League endowments. Yale extended its lengthy history of positive idiosyncratic performance, recording the highest annual selection return of any of the Ivy Leagues.
As depicted in the graph below, this positive selection return may be explained by Yale’s focus on allocating assets among a skillfully selected set of external managers in contrast to Harvard’s hybrid system which, in addition to asset allocation to external managers, concentrated measurably more resources on selecting individual securities and managing a significant portion of the $37-billion endowment in-house.
Conclusion
Endowment returns dropped off substantially in 2016. The allocation of assets to different classes heavily influenced endowment performance outcomes for the year. Dragged down by commodities, global equities, hedge funds, and venture capital, many endowments posted negative returns. Selection – that part of fund returns associated with manager as well as security selection – did not register positive contributions among Ivy League portfolios as a whole. Nevertheless, Yale continued its strong performance by avoiding troubled asset classes and focusing on private investments.
This study confirms once again that asset allocation is dominating year-to-year results among the Ivy League’s pack. This study also highlights the range of raw information that may be gleaned from a relatively small amount of publicly available data.
Footnotes
- 1Given that we have only 10 data points the number of factors has to be small. The factors chosen for this analysis were felt to offer a good high-level, asset-based look across all portfolios.
- 22nd QTR returns are preliminary and not finalized.
- 3The Eurekahedge 50 Index, created in partnership by MPI and Eurekahedge, is a more concentrated index of hedge funds than commonly cited broad measures of the hedge fund universe. Unlike all other hedge fund indices that are too diversified and have significant strategy and performance biases, the EH50 is comprised of only large, institutional quality hedge funds. As such, it is a more appropriate benchmark for endowment programs that have long-standing hedge fund investing programs with legacy access to top hedge fund talent. For this study we extended the index with pro-forma return data for 2004-2006 prior to the EH50 official inception date in 2007.