
Following the news of CalPERS’ termination of its ARS program and at the request of Risk Magazine, we looked at the relationship between scale, selection and impact on total portfolio returns that hedge fund allocations can possibly have at large pensions.
To perform this study, we base our hypothetical pension portfolio off of CalPERS’ portfolio. The typical pension portfolio is heavily tilted towards equities while maintaining exposure to various other asset classes. Below is the composition of the CalPERS policy benchmark as of July 1, 2011. We have chosen the below listed proxy index for each asset class weighting. While this does not represent the actual portfolio, for our purposes here it can be considered close enough:
| Asset Class | Proxy Index | Weight |
| Public Equity | FTSE All World Price Index | 49.1% |
| Fixed Income | Barclay’s Long Liability Index | 15.9% |
| Real Estate | NCREIF ODCE Index | 10% |
| Private Equity | LPX 50 | 14% |
| Infrastracture/Forestland | S&P Timberland | 3% |
| Inflation Assets | Barclay’s US Treasury Inflation Notes | 4% |
| Liquidity | Barclay’s US Aggregate Treasury Index | 4% |
There are two main issues with HF allocations. The first pertains to fund selection and the second to allocation. In this study we attempt to tackle both.
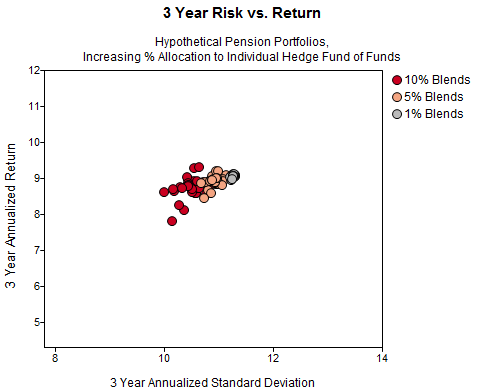
We then calculated the risk and return of the above total portfolio by assuming different levels of HF allocation1. To proxy for hedge funds, we used fund of hedge funds (FoHFs) with AUM over 1billion USD2. We then selected one FoHF at a time and we assumed it forms part of the CalPERS portfolio with a 1%, 5% and 10% allocation. We calculated the risk and return profile for each portfolio combination over the past 3 years3, which produced the below scatterplot.

Right away we can see that fund selection is very important and has the potential to significantly alter the risk and return profile of the portfolio. Not surprisingly, we also note 1) the decrease in volatility and 2) the wider range of results (both returns and volatility) that accompany increased allocations. The portfolios with a 1% allocation are not able to produce such a range of outcomes, nor is selection skill capable of showing through when the allocation is so insignificant.
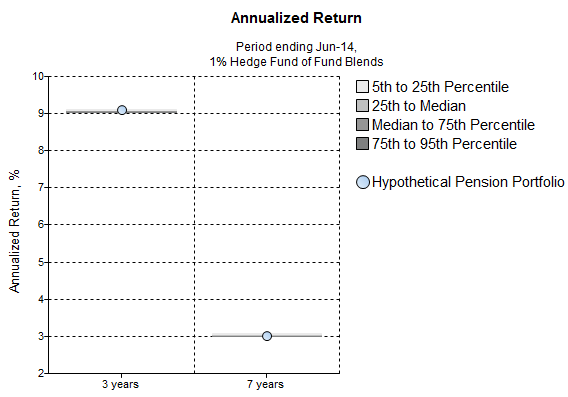
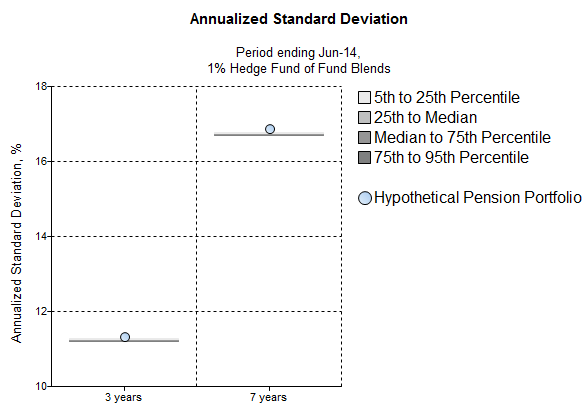
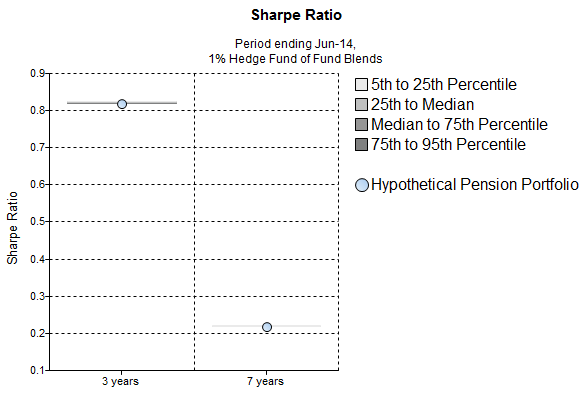
Given the above, we now focus on a 10% allocation to hedge funds, which is quite common among pension portfolios4. In the below charts, we show the return, risk, and Sharpe ratio of the base portfolio ex-hedge funds (represented by the blue dot) and the range of values (of the same measures) formed based on the different FoHFs inserted into the portfolio. Both are shown for a period spanning the past 3 and 7 years, which encompasses the broad bull market and the Financial Crisis, respectively.
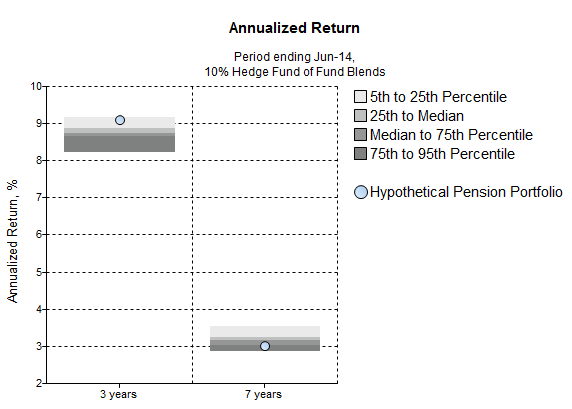
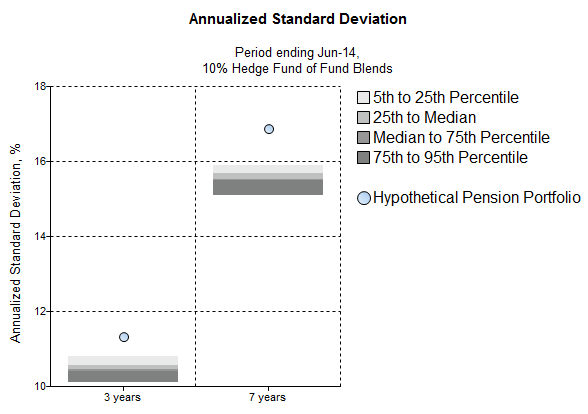
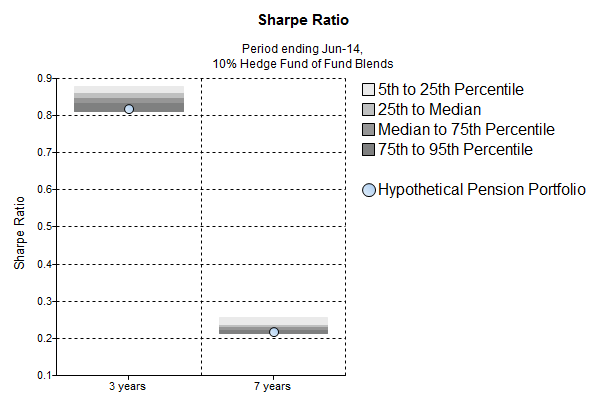
We observe that the results are highly dependent on the regime and time horizon under consideration. The most recent 3 year period demonstrates that adding hedge funds results in a lower return profile across most combinations but on the other hand also reduces the risk of the portfolio. The Sharpe ratio, which takes into account both, would actually increase with most combinations. Over the recent 7 year period covering the Financial Crisis, we see that over 75% of tested hedge fund investments would actually increase the portfolio’s returns at a 10% allocation, in addition to dampening volatility significantly (in all instances) and increasing Sharpe ratio (most cases).
We repeated the above exercise assuming 1% (the below 3 charts with narrow bands between percentiles) and 5% (the next 3 charts, featuring greater range between percentile bands) hedge fund allocations:
5% Allocations Below:
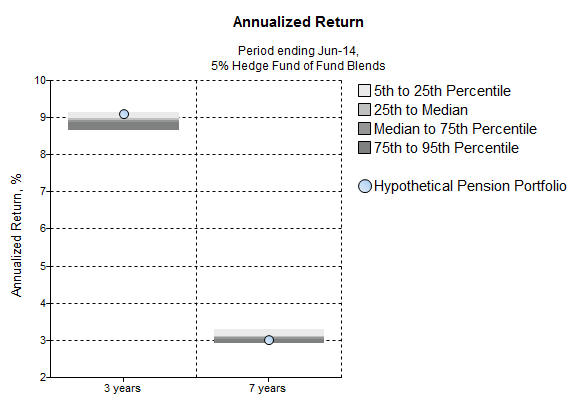
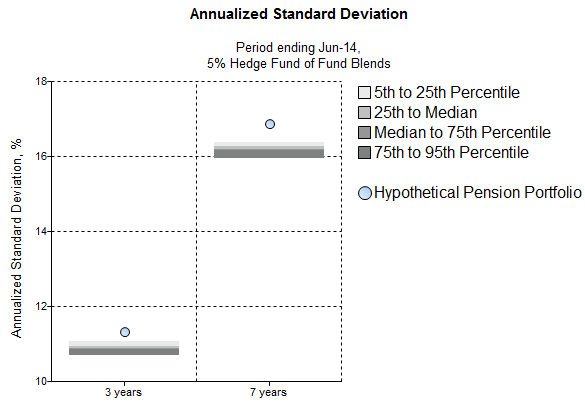
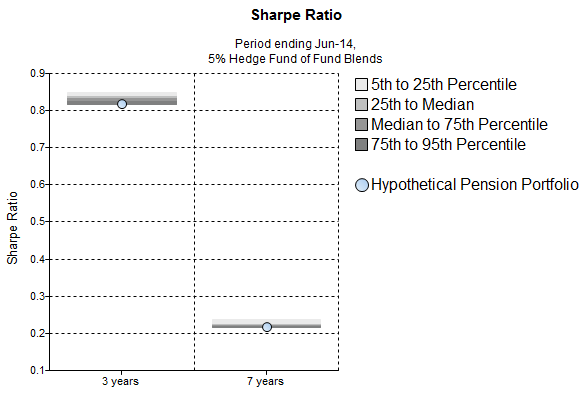
We observe that the 1% allocation hardly changes the portfolio profile. Fund selection by itself doesn’t really matter, neither does the time horizon. The 10% allocation can offer a return greater than the base portfolio over the past 3 years, while the 5% allocation consistently offers a greater Sharpe ratio than the base portfolio over the past 3 or 7 years. The portfolio risk is consistently decreased by both the 5% and 10% allocations.
Depending on the investor focus, a 1% or no allocation might make more sense if one is only looking at the recent return profile. Otherwise, for a longer time horizon or under other measures mentioned above, a 5% or 10% allocation to hedge funds makes more sense.
Scale is clearly a challenge with a portfolio as large as CalPERS, but with a larger allocation we show how a range of FoHFs could positively benefit a portfolio’s return profile.5
This brings up the issue of selection and fees, however, and highlights problems with the hedge fund fee structure that feeds so many mediocre strategies and allows the universe of managers to grow. CalPERS paid $135 million for a $265 million, or 7.1%, net gain on the ARS portfolio over the most recent fiscal year6. CalPERS states that the decision to eliminate ARS was “not based on performance”, but looking at the track record of the ARS program over short- and long-term windows, we see selection of direct and multi-manager investments proved challenging and lagged average hedge fund results (proxied by HFR Composite and HFR FoF Indexes, respectively). While selection at such an insignificant allocation does not have the ability to impact the total portfolio’s risk-return profile, CalPERS’ experience underscores how difficult it is to select superior funds.
Any higher expectations from any pension’s hedge fund managers has to be factored into the fee structure: hedge funds should be incentivized only for achieving certain performance and risk goals, not just delivering beta. This move sends a strong message to institutions to stop treating hedge funds as “absolute return” “black boxes” but rather set appropriate beta-benchmarks, like they do to the 90%+ of the rest of their portfolio.
Footnotes
- 1To compensate for the increases in HF allocation, we displace weighting to other asset classes equally, proportionate to their base weights.
- 2From HFR FOF Database: https://www.hedgefundresearch.com/?fuse=products-fof
- 37/2011 – 6/2014
- 4Agecroft Partners notes that the average allocation to HFs by multi-billion dollar public pensions is approximately 8% http://www.agecroftpartners.com/papers-increase_HFallocation.html
- 5Implementation and concentration are issues not addressed here, and deserving of further attention.
- 6Representing a (roughly) 1.5% and 20% fee structure.