US state pension plans’ estimated aggregate funding ratio at the end of fiscal year 2020 fell to 70% from 72.7% the previous year, according to a report from Wilshire Associates. This underfunded ratio puts the aggregate underfunded amount at $1.394T.
But chronic underfunding is not the only issue ailing US state pension funds. Forensic investigations have revealed that public pensions in states such as Pennsylvania, California, Tennessee, Rhode Island, North Carolina, and, most recently, Ohio, have abandoned transparency. Furthermore, the FBI has launched an investigation into the Pennsylvania Public School Employees’ Retirement System (PSERS), suggesting there may have been criminal behavior within this pension system.
These facts support the assertion that transparency into US public pension funds is urgently needed to identify the risks these funds have historically taken; assess if historical returns were commensurate with the risk exposure; and determine if the current level of risk is appropriate for each fund’s respective risk tolerance.
Norway’s sovereign wealth fund (Norges) is the world’s largest ($1.3T USD AUM), but unlike some US public pensions, it is widely recognized as a global leader in transparency as well. Most importantly, they provide monthly fund performance figures as part of their public disclosure – a rather unusual step for a pension fund. Such monthly performance represents a composite of dozens if not hundreds of individual portfolios with varying allocations both within each such portfolio (portfolio management decisions) as well as between portfolios (pension asset manager’s decisions). And while all allocation moves are blended in such a composite, there’s a technique that allows one to recover top level allocation information just from returns alone.
Such top-down method of analyzing investment portfolios is called Returns-Based Style Analysis (“RBSA”) – as opposed to bottom-up approach using actual position information. It was first introduced by Nobel Laureate Prof. William Sharpe in the late 1980’s to identify a credible portfolio of systematic market factors that explain or best mimic a given fund’s performance results. Since its introduction, RBSA and its various forms have been widely used to identify managers’ investment styles, across both traditional and alternative investment funds.
However, a major drawback for RBSA in its original form is the basic assumption that the investment style of a fund remains fixed over the whole sample period. The use of rolling window regressions alleviates the drawback to a certain extent but proves to be inadequate in capturing rapid portfolio changes. MPI’s innovative Dynamic Style Analysis (DSA) represents a significant improvement and is designed to capture portfolio’s time-varying exposures using filtering technique similar to target-tracking technology used by the military to track quickly moving targets, instantaneously detecting changes in direction and acceleration in space.
In this article, using MPI’s Stylus Pro system we will demonstrate how advanced returns-based techniques can take a monthly time series of a fund’s returns as an input and provide insight into its allocation decisions that is both as extensive, and precise, as that provided by Norges; the implication being that similar transparency into opaque US public pension funds can be gained with the precision demonstrated in the Norges example.
The Norway Model
Norges has built a reputation for transparency. The Ministry and NBIM websites make available an extensive list of publications detailing the fund’s investment performance, governance, responsible investing policies, etc. These publications are available in English as well as Norwegian.
What truly sets Norges apart in transparency is that they provide monthly fund returns in various currencies and broken down by asset classes. After reviewing these materials, we can summarize the following distinct investment characters of Norway’s Sovereign Wealth Fund or “The Norway Model”, that makes it a perfect candidate for return-based style analysis:
- Norway relies almost exclusively on publicly-traded securities, which means that its asset allocation can be easily mapped with generic market indexes.
- The proportion of active management in Norway’s portfolio is minimal, as the fund is constrained by a very small tracking error to its benchmarks.
- This implies that the majority of the fund returns can be explained by its investment style. Unlike Ivy League endowments, which only make annual composite reports publicly available, Norges provides monthly performance data – both for the composite a and asset class sleeves.
- The transparency provided by Norges with regards to the fund’s historical asset allocation can be used to validate the accuracy of the returns-based analysis.
Data, Style Maps and Model
As discussed previously, Norges provides a monthly time series of returns for the public securities in its portfolio in USD going back to 1998. This excludes the private real estate allocation of the portfolio; however in 2020 the private real estate allocation was only 2.5% of the total portfolio, and the fund only made its first private real estate purchase in April 2011. Therefore, this analysis includes all of the Norges portfolio through April 2011 and virtually all of it post-April 2011.
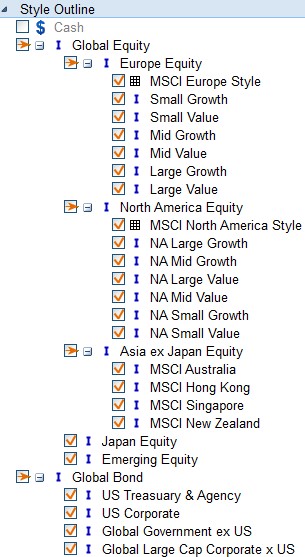
While the fund provides full transparency about its allocations, we should not forget that it represents a complex investment portfolio with equity and bonds investments across Europe, US, Asia and Emerging markets. To perform a good style analysis, we had to build a comprehensive style map structure that first breaks down the portfolio asset classes; then regions; then factors. This allows us to review the top-level changes in the asset allocation of the fund and drill down to individual equity factors by region.
The top-level asset allocation categories are as follows:
- Developed Europe Equity
- Developed North America Equity
- Japan Equity
- Developed Asia Pacific ex-Japan Equity
- Emerging Equity
- Global Bonds
For our analysis we utilize Dynamic Style Analysis (DSA), which overcomes the shortcomings of existing multi-factor models in detecting investment portfolio dynamics such as gradual style drift or rapid changes in strategy. Unlike rolling-window regressions, DSA also allows us to use a large number of factors and, at the same time, control for the model overfit. The objective of such an approach is to determine a dynamic portfolio of factors/indices that closely mimics (replicates) the performance of the analyzed portfolio (Norges’ track record in our case).
Factor Model Quality
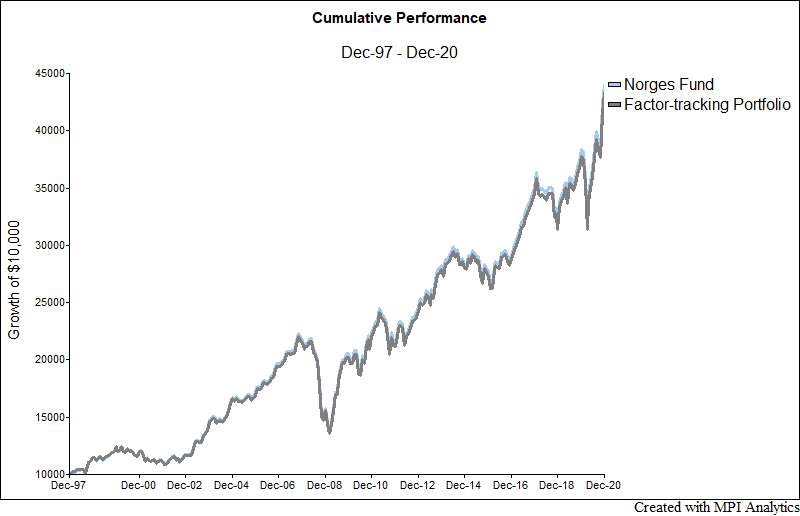
For our dynamic analysis we used 23 years of monthly data and 22 indices. Typically, with shorter time series, a smaller number of factors can be used. The advantage of the dynamic “window-less” model (DSA) is that it allows us to use large number of factors. The overall quality of the analysis is very high, with the R-squared at 99.96% and predicted R-squared [1] at 99.86%. This validates the general investment mandate of the fund: that Norges is invested predominantly in tradable equities and bonds with limited tracking error against their benchmark indexes (thus, the high R-squareds). Such high R-squareds generally manifest themselves in a very low tracking error to the factor-tracking-portfolio, which can be observed in the chart above – where Style (factor portfolio) coincides with the Total (Norges composite performance).
Results – Broad Investment Styles
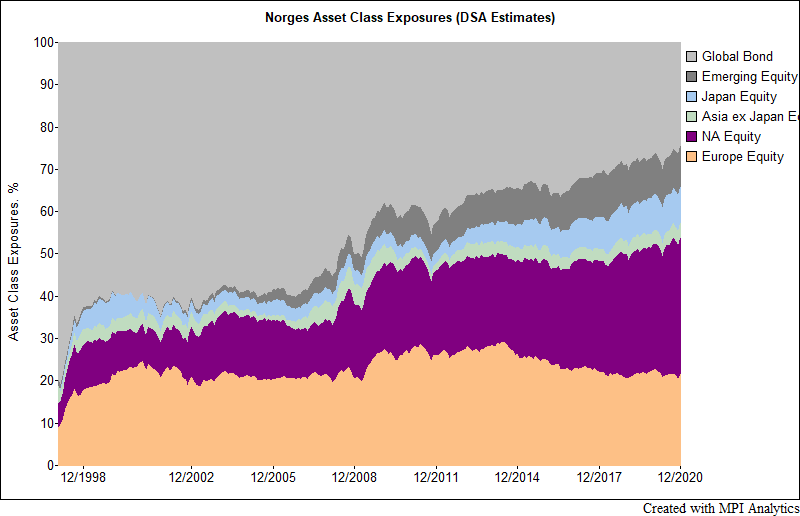
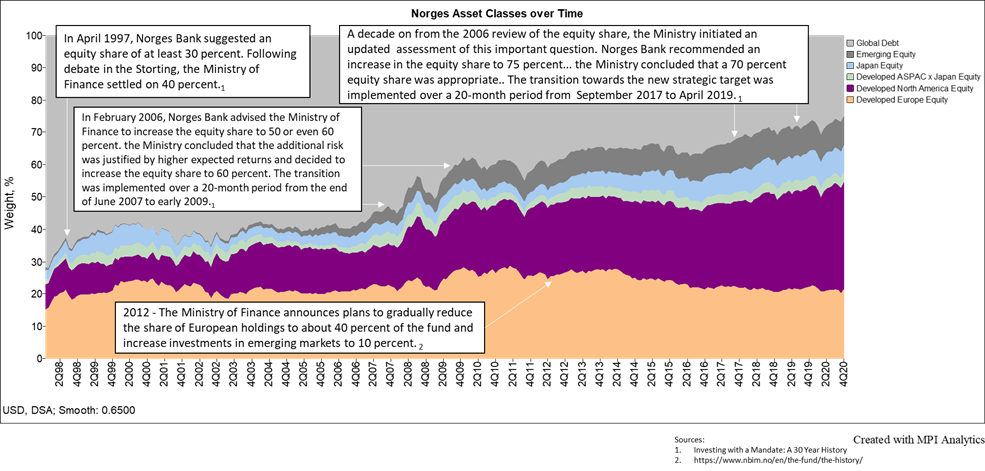
Although we performed analysis using all factors above, we aggregated resulting exposures by broad asset class to provide a top-level view on the evolution of Norges’ allocation. The chart below illustrates that our analysis captures one main trend of Norges’ investment story: a general move from bonds to equities over time. Each color band represents DSA-estimated historical exposures to a particular asset, with all exposures adding to 100%. At the beginning of 1998, the total equity exposure was only 30%, while bonds comprised 70% of the total portfolio. At the end of 2020, the allocation was reversed and the total equity exposure was over 70% of the portfolio.
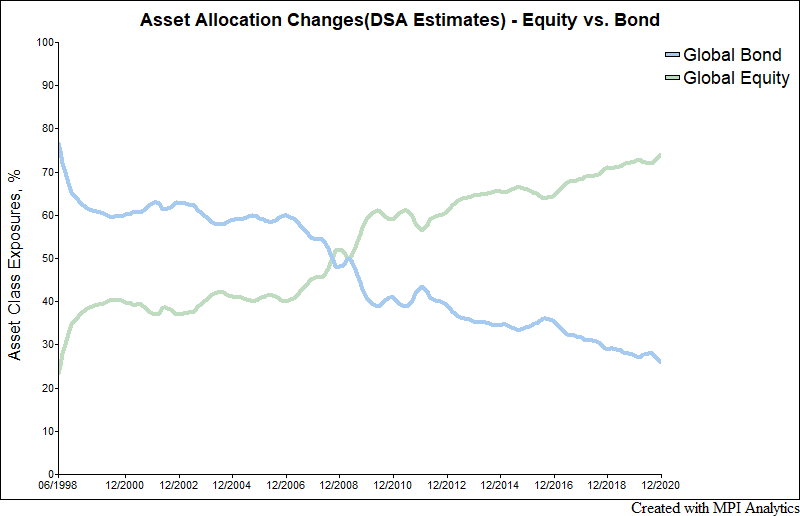
This dynamics between equity and bonds is highlighted further in this supplementary line chart below, in which we aggregate all equity exposures into Global equity and all bond exposures into Global bond. Interestingly, the fund continued to increase its equity exposures even after the financial crisis in 2007-2008.
At this level of aggregation, we can compare the results of the model to what Norges reported about how their portfolio has changed over time. The document “Investing with a Mandate” provides details on these portfolio changes and the time frame over which these changes took place. In addition, their website provides a high-level history of the fund. The style map of the portfolio is shown below with pertinent excerpts from both references.
See that the style portfolio lines up exceptionally well with what Norges stated they were doing with their portfolio.
Investment styles within Equity and Fixed Income
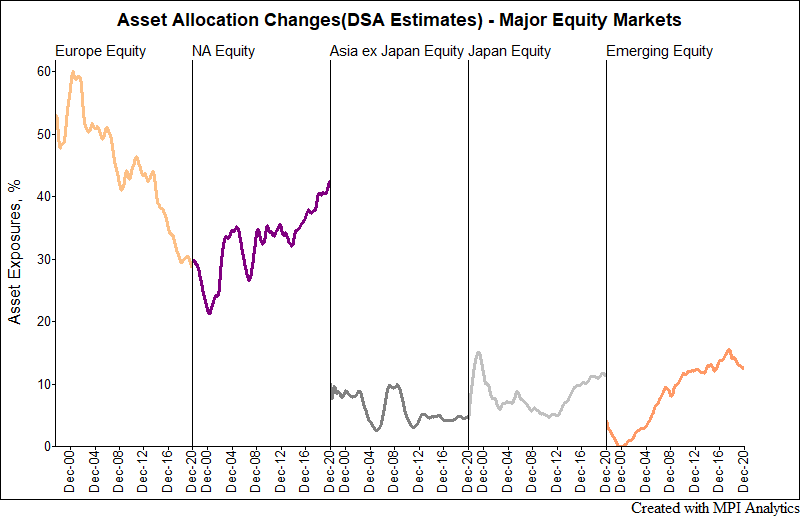
Our comprehensive style map also allows us to study the composition changes within the equity and bond allocations. The line charts below depict the rescaled weights within the equity and bond portfolios respectively. Within equity, we see that the allocation to European equity as a percentage of total equity has decreased since 1998, with the allocation starting around 55%; increasing to 60%; then decreasing to the current mid 30% range. This decrease in European stock concentration was largely offset by an increase in North American stock concentration to the mid 40% range from approximately 30%. Japanese stocks consisted of approximately 10% of the portfolio in 1998; decreased to 5% in 2010; and are now in the 10% range. Over this 23-year time period, the stock allocation to Emerging Equity has gone from no material allocation to an allocation in the 10% range. These changes reflect a move from a tilt towards European and developed markets, towards a more global, market capitalization-weighted allocation.
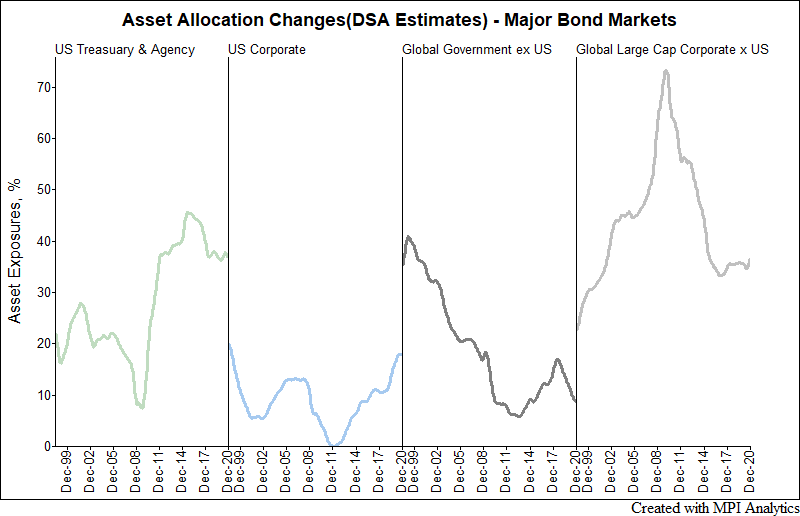
If we break out the debt portion of the Norges portfolio, we see that in 1998 approximately 60% of the debt in the portfolio was sovereign debt with a concentration in non-US government debt. This changed quite dramatically to 70% non-US corporate debt going into the GFC and has since changed to approximately 40% US government and agency debt and another 40% non-US corporate debt.
Equity Style Dynamics versus Market Benchmarks
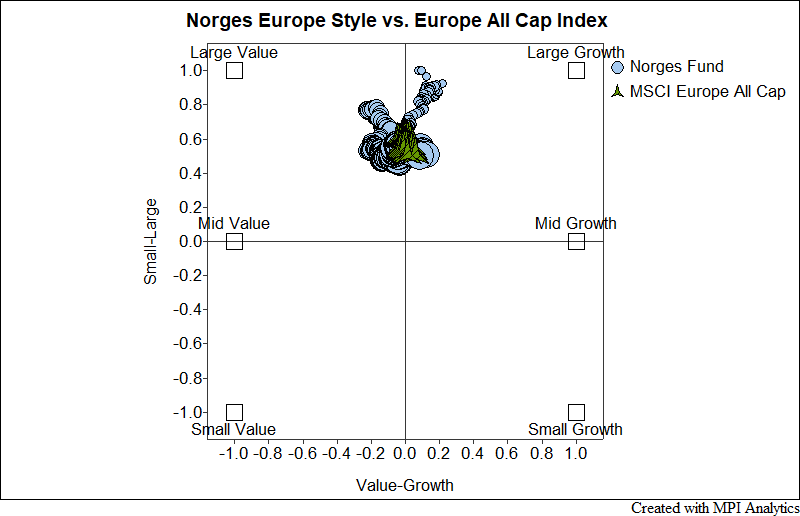
The chart below compares Norges’ European stock portfolio to that of a European market capitalization weighted index over time. Within the chart, the more recent data points appear as larger symbols. The MSCI European All Cap Index has historically shown a neutral tilt between value and growth by design, and appears tilted towards large cap stocks. The evolution of Norges’ European portfolio shows it started with a large cap growth tilt, progressed to being slightly value weighted and moving into mid and small cap stocks, and by 2020 the Norges portfolio very closely resembled a European market cap weighted index.
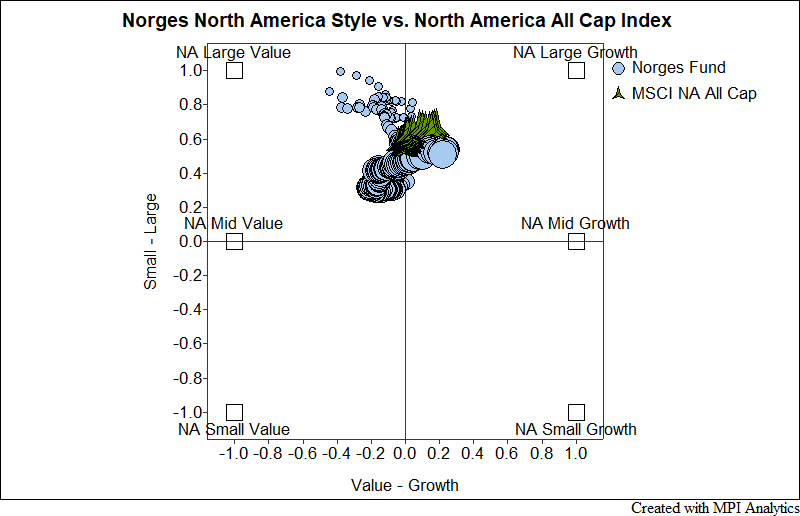
A similar chart for North American equities shows that Norges started with a large cap value tilt and, recently, its composite exposure moved closer to core and mid-cap stocks. In 2020 the portfolio had a neutral value-versus-growth exposure but was slightly tilted towards small and medium capitalization stocks.
Thus, analysis of monthly composite returns time series allows one to gain insight not only into broad asset allocation, but also into style, sector or country tilts within each allocation sleeve. The ultimate transparency, without the need for a full monthly portfolio disclosure.
Concluding Remarks
Using Norges as an example, we demonstrate that a return-based analysis can reveal detailed information about a large and complex investment portfolio with tremendous precision. A similar analysis can be performed on any pension portfolio using only a monthly time series of composite returns, bringing transparency similar to that provided by Norges as it relates to the timing of important allocation decisions, intended or unintended style and risk tilts as well as general adequacy of their stated benchmarks.
As we will demonstrate in subsequent research series, the creation of a style portfolio facilitates the examination of pertinent questions regarding Norges and its performance. Some of the most interesting topics we address are Norges’ ability to generate alpha in comparison to its style portfolio; why Norges’ tracking error between the its benchmark and its style greatly diverged during the GFC; how Norges’ risk has changed over time; why the expected loss today during a GFC event would be higher than it experienced during the GFC; and contrasting our findings on Norges’ active performance to academic findings that used returns based style analysis employing regressions.
____________________________________________________________________________________________________________________________________________________________________________________
[1] The predicted style R-Squared (PR2) metric describes how well the factor model was able to predict (estimate) performance in each subsequent period using the factor model. The difference between the predicted return (using the factor exposures from each prior period) and the actual return is quantified with the PR2 metric. The phrases “in sample” (R2) versus “out of sample” (PR2) are generally used to make this comparison. MPI’s PR2 computation technique is borrowed from machine learning and is often used as part of an optimization to select the subset of factors that will maximize predictability.