
Michael Markov and Kushal Kshirsagar
With AXA Rosenberg’s recent admission of a 2009 coding error in its portfolio risk management programs during a year in which the firm’s equity mutual funds lagged their benchmarks by a large margin, the investment community must reflect on how we monitor investments. Specifically, investors (and their advisers) must ask if we have the right tools and protocols to identify unusual risk and performance patterns in a timely manner.
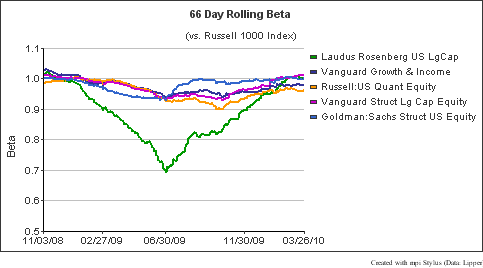
According to the company’s statement in an April 15th letter to investors, the error was discovered in June 2009 and fixed between September and mid-November. Because the “coding error” apparently impacted risk controls, we examined two basic risk measures that are routinely used by both fund managers and investors to evaluate and monitor investment products: Beta and Tracking Error. The chart below shows Beta of the Laudus Rosenberg US Large Capitalization Fund in 2009 with a sample of its peers computed using daily fund NAVs1.

![]()
Using daily data to monitor Laudus Rosenberg’s beta and tracking error, could we have raised a red flag in June 2009?

![]()
It is worth stressing that such an apparent aberration in the fund’s risk profile could be most clearly seen using daily data. Unfortunately, investors typically use monthly data even though daily returns are now easily available from data providers (e.g. Lipper), public sources (Yahoo, Google, etc.), funds and custodians. When using monthly data, a longer history needs to be used to have sufficient observations to estimate the regression. This longer history may cloud, or, as in the case of the Laudus Rosenberg fund, completely transform the picture. The chart below uses a rolling 24 month window to calculate the fund’s beta.

When used in more granular returns-based analysis (RBSA), daily fund NAVs could provide answers to specific questions about attribution of the fund’s gains or losses: what bets were made, when and for how long and with what impact on both performance and risk. Thus, in one of our recent research papers on Oppenheimer Core Bond Fund, we demonstrated the importance of daily data in analysis, surveillance and monitoring leverage of complex fixed-income portfolios having derivative exposure.
Related links:
http://online.wsj.com/article/SB10001424052748704388304575202501743719416.html
http://www.pionline.com/article/20100419/PRINTSUB/304199980
http://www.pionline.com/article/20100518/DAILYREG/100519849
http://news.morningstar.com/articlenet/article.aspx?id=335669
http://online.wsj.com/article/BT-CO-20100510-714684.html
_____________________________________
Footnotes
- 1The daily fund beta is calculated vs. Russell 1000 Index using rolling 66-day (approximately 3 calendar months) calculations. Russell 1000 is the stated benchmark of the Laudus fund.
- 2Details on the other quant equity funds used in the study:
- The Vanguard Growth & Income fund is sub-advised by Mellon and uses the S&P 500 as a benchmark.
- The Russell US Quant Equity fund is a fund of quantitative funds and currently has 6 sub-advisers: Aronson + Johnson + Ortiz, Goldman Sachs Asset Management, INTECH, Jacobs Levy, Numeric and Russell Investment Management Company
- The Vanguard Structured Large-Cap Equity Fund (VSLIX) employs a quantitative strategy and is managed by the Vanguard Quantitative Equity Group. Benchmark: S&P 500 Index
- The Goldman Sachs Structured US Equity fund is managed by Goldman Sachs Asset Management and uses the S&P 500 as its benchmark.