
Global Equity funds’ performance ranges from -25.83% to slightly over 89% over the last 52 weeks (ending December 31, 2010), in EUR terms. The best 5% of the funds outperform the market (pegged to the MSCI World TR Index) by 12.6% and the worst 5% underperform by approximately 25%.What role do favourable style allocations play? We take a closer look at common factors describing the best and worst funds on an aggregate basis. When funds are aggregated in a group, their common factors crystallize and specific bets are diversified away, which provides the basis for such an analysis. Our analysis suggests that the top- and bottom-performing funds, on average, invested in quite different sectors which impacted their performance. The performance of the top 5% was mainly a reflection of their selection and timing skills, having over weighted their exposures to Japan and Emerging Markets, as well as a sizeable exposure to Cash. Conversely, the bottom 5% display negative selection and timing skills, with very high exposures to Global Clean Energy and Cash. Using an attribution framework, we were able to quantify the impact of each bet on the overall performance. Note that our conclusions may change if a different timeframe is used to select the best/worst funds. Click here to download the PDF.
Universe Overview
– The universe is comprised of 567 funds that are classified under Lipper Global: Equity Global, with AUM of at least EUR 10 million and denominated in EUR. Our analysis only takes into account the performance of the Primary Share Class, as defined in Lipper Hindsight.
– RBSA analysis of the universe suggests that the Cash exposure for the managers in the universe tends to be higher for the worst performing funds. This large exposure might indicate that the funds use derivatives to hedge their different market and currency risks.
– The best performing funds display risk (as measured by the annualized standard deviation) that is in line with that worst performing funds as well as that for the rest of the universe.
– RBSA average exposures to different regions, over the past 52 weeks, suggest that the funds in the universe are mostly tilted towards the USA, Japan, and Europe.

Selection of Top/Bottom Fund Groups
– Based on the universe of 567 funds, the total annualized performance over the past 52 weeks ending on December 31, 2010 is calculated and used to rank the funds from best to worst. Using the top 5% (29 funds) and bottom 5% (34 funds), equally weighted – daily rebalanced portfolios are created and analyzed within an RBSA attribution framework to try to understand why, on average, one group performed than the other.
– As shown below, not surprisingly, the top 5% of funds outperform its peers, benchmark and bottom 5%. Over the period of analysis, the top 5% return approximately 12.6% above the MSCI World TR Index (the benchmarks) while the bottom 5% return 25% below the index.

Returns-Based Style Analysis Highlights
– We decided to use regional market indices for the style analysis together with a Clean Energy Index since the majority of the bottom funds have a strong exposure to alternative energy stocks.
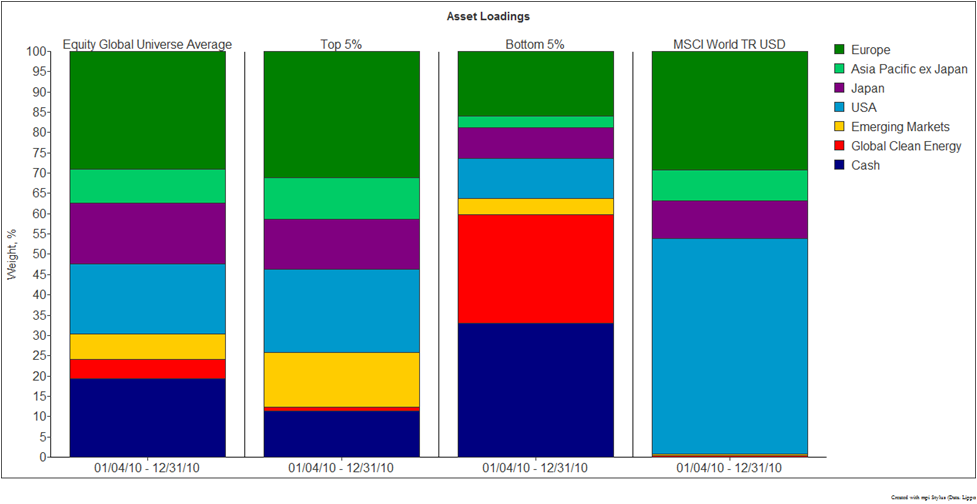
– Our RBSA analysis demonstrates that the top 5% are diversified, with significant style exposures to Europe, the USA, Japan, Emerging Markets, Asia Pacific ex Japan and Cash. The Cash exposure of approximately 11% can be explained by any hedge instruments the managers might use to mitigate any specific country or market and currency risk to which Global funds are exposed.
– The bottom funds’ exhibit very concentrated exposures, with Cash and Clean Energy making up over 60% of the portfolio. We took an in depth look into some of the 34 funds in the bottom 5% to understand the concentrated exposures. We found that the funds had many Top 10 Holdings in common, which were concentrated in clean energy and water related stocks. The significant Cash exposure could be the result of hedging, fixed income holdings, or holding low beta stocks.
– When comparing the top and bottom funds versus the overall universe, differences among the funds become apparent. The bottom funds have a higher exposure to Cash and Clean Energy than the overall universe, while being less exposed to Europe, Asia Pacific ex Japan, Japan, and the USA. Whereas the top funds favor Emerging Markets, the USA, Asia Pacific ex Japan, and Europe.
– Blending a large number of funds together in an equally-weighted portfolio results in high explanatory power for the analysis of the top 5% with an R-Squared value of 91.5%, and 88.9% the bottom 5%.

– As a group, the top 5% display very strong selection and timing skills, whereas the bottom 5% show significant negative selection and timing. Selection and timing returns represent components of excess performance over the benchmark.

– Attribution analysis can clarify if decisions to over- and under-weigh different styles (vs. the benchmark) aided or hurt the funds. Overexposure to Cash and Clean Energy hurt the bottom 5%, while overexposure to Emerging Markets and underexposure to Europe produced a positive timing effect. Overall, the bottom 5% decisions provided for a large underperformance vs. the benchmark. The top 5% decisions to overweigh Europe, Asia Pacific ex Japan, Japan, and Emerging Markets provide for an overall positive timing effect, allowing these funds to outperform the benchmark.

Rolling Risk/Return Analysis
– Top 5% tracked the benchmark very closely, on a 12-week rolling basis, for the first 3 quarters of the year. It is really the past 3 months during which the fund outperformed the benchmark and allowed them to finish the year with an excess performance of over 12%. The bottom 5% consistently underperformed the benchmark, providing for an overall underperformance of slightly over 25%.

– The bottom and top 5% display rolling risk, as defined by the 12 week rolling standard deviation, that tracked each other closely, albeit with the top performers displaying slightly higher risk during the period analyzed. The benchmark displayed higher risk than both funds, close to a total of 16% over the same period, vs. 13.68% for the top 5% and 12.9 for the bottom 5%.
– In terms of risk adjusted performance, as defined by the Information Ratio, the top 5% clearly dominated the bottom 5%, with an IR of 2.61 vs. -3.57.

– On a risk-adjusted basis and comparing the funds with the Capital Market Line, the top 5% portfolio provides a higher return per unit of risk than the benchmark. The bottom 5% and the universe average do not provide an adequate return for the risk to which they are exposed.

UNIVERSE DEFINITIONS & ASSUMPTIONS
- Database provider: Lipper, a Thomson Reuters Company
- Registered for sale countries: Austria, France, Germany, Italy, Netherlands, Offshore, Spain, Sweden, Switzerland, and the UK
- Filters: share class, at least 1 year of performance history, Asset Type: Equity, Geographical Focus: Global Equity, Lipper Global Category: Equity Global, AUM: minimum EUR 10 Million, Denominated in EUR
- Number of funds analyzed: 567
- Date interval: Last 52 weeks starting on January 4, 2010 and ending on December 31, 2010
- Currency: EUR
- Analysis Frequency: Weekly (with compounded daily data)
- Cash proxy (Risk Free Rate): EONIA Index
- Benchmark: MSCI World TR
- Style factors: MSCI Indices – EM (Emerging Markets), USA, Japan, AC Asia Pacific ex Japan, Europe; and S&P Global Clean Energy Index
- Analysis performed with mpi Stylus Pro™
Style Return: Return of the Best Fit Portfolio for the Manager Series, where the holdings of the portfolio are the Style Indices.
Selection Return: Calculated as the Manager’s Return subtracted by the Style Return. This is an indication of the Manager’s Selection or Stock Picking abilities.
Timing Return: Calculated as the Manager’s Style Return subtracted by the Benchmark’s Style Return. This indicates whether the Manager’s decisions, to over or under weight the style holdings, as compared to the benchmark, added to the portfolio’s return or not.
Style R Squared (R2): Measure of the model’s power in describing the Manager’s past behaviour in terms of style. The higher the Style R Squared value, the better the model’s explanatory power.
Predicted Style R Squared (PR2): Measure of the model’s power in predicting the Manager’s future behaviour in terms of style. The higher the Predicted Style R Squared value, the better the model’s predictive power.
Style Map: Graphic representation of the results of the Style Analysis. The series being analyzed are mapped unto a Cartesian plane, in which the X and Y axis represent exposures to different Styles and Sizes.
Asset Loadings: Weights of the Style Indices, as holdings, of the Style Portfolio, as calculated by mpi Stylus Pro.
——————————————————————————————————————————-
Markov Processes International, LLC (MPI) is a global provider of investment research and technology solutions. MPI’s analytical tools and methodologies are employed by the finest institutions and financial services organizations to enhance their investment research, reporting, data integration and content distribution. MPI offers the most advanced platform available to analyze hedge funds, mutual funds, portfolios and other investment products, as well as asset allocation and portfolio optimization tools.
MPI’s Stylus Pro software is utilized by alternative research groups, hedge fund of funds, family offices, institutional investors, consultants, private banks, asset managers, diversified financial services organizations as well as marketing, product development and IT departments around the world. MPI also offers solutions for investment advisors and private wealth professionals. For more information on past MPI research articles visit http://markovprocesses.com/company/research.htm