Target Date Funds stumbled hard in 2008 when near-dated funds failed to provide the capital protection they were meant to for investors approaching retirement. ‘Brexit’ may not be a Lehman Brothers-scale event, but it can certainly serve notice of some of the risks currently being assumed in near-dated Target Date Funds. Below we illustrate how such an event could be (a) used as a litmus test to reconcile TDF information with performance results; and (b) alert to suitability of the selected investment option.
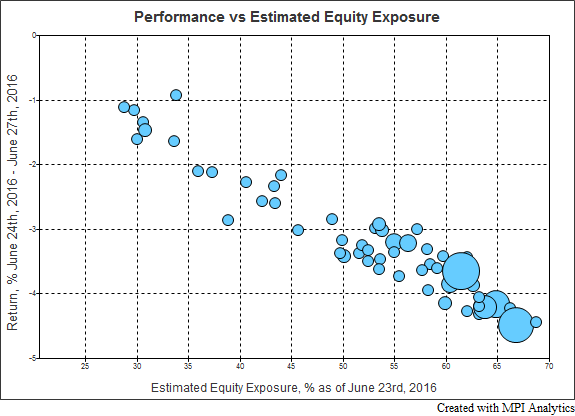
The two days immediately following the Brexit referendum were particularly volatile, while markets digested the unanticipated outcome. The chart below depicts the return distribution of 2020 (the current nearest date) Target Date Funds between Friday, June 24th and Monday, June 27th, with realized net performance ranging between -4.5% and -0.9% and an average loss of -3.2%. The S&P 500 Index lost -5.3% over the same period.
In glide path terms, the Brexit-related average loss of -3.2% compares to a portfolio of 52% exposure in global equities.1 This is also the average estimated equity exposure of these funds using returns based style analysis and it corresponds closely to the industry average reported by Morningstar as of Q1 2016.
Clearly there is a lot of dispersion around the average values. Within this dispersion, we note that some of the largest funds by assets (represented by larger bubbles in the chart below) tend to congregate at the more aggressive end of the spectrum.
On an asset-weighted basis, this increases the average 2-day post Brexit loss for 2020 funds to -3.8%, with a corresponding estimated weighted average equity exposure of 62%.
To put this in context, during the circa-2008 financial crisis2 the average maximum drawdown was -36%3 for 2010 Target Date Funds (the nearest retirement date at the time). As a result, Target Date Funds drew a great deal of criticism for being over-exposed to equities in their near-retirement vintages. According to Morningstar, the average equity allocation of 2010 Target Date funds in 2008 was 50%, with values ranging broadly – between 26% and 72% and resultant max drawdown values between -20% and -54%.
A relatively large equity allocation near one’s “official” retirement may be entirely appropriate or potentially disastrous under different circumstances – particularly depending on whether or not an investor intends to start drawing down immediately, as well as the content of their other portfolio holdings.
Target Date funds’ near-dated equity exposure may not have changed much since 2008, but there remains a broad and growing range in options available to investors. In the current environment of high economic uncertainty, with many assets considered overbought (and few underbought), investors and fiduciaries need to be aware of the large dispersion in allocation glide paths and what is appropriate to which investors, particularly when near retirement.
_________________________________________________________________________
DISCLAIMER: MPI conducts returns-based analyses and, beyond any public information, does not claim to know or imply what the actual strategy, positions or holdings of the funds discussed are, nor are we commenting on the quality or merits of the actual investment strategies. This analysis is purely returns-based and does not reflect insights into actual holdings. Deviations between our analysis and the actual holdings and/or management decisions made by funds are expected and inherent in any quantitative risk factor analysis. MPI makes no warranties or guarantees as to the accuracy of this statistical analysis, nor does it take any responsibility for investment decisions made by any parties based on this analysis.
Footnotes
- 1Equities represented by MSCI World Index and fixed income by the Barcap US Aggregate Index
- 2Specific dates vary somewhat: approximately between November 2007 and March 2009
- 3Source: Morningstar. Group consists of 2010 Funds with data available throughout the relevant time period.
