
North America Equity USD denominated funds’ performances range from -54.91% to 13.04% over the last 52 weeks (ending December 2, 2011), in USD terms. On average, the best 5% of the funds outperform the market (pegged to the S&P 500 Index) by approximately 5.13% and the worst 5% underperform by approximately 15.73%. We last analyzed this asset class back in December 2010 and found that at the time, as a group, the best funds outperformed the benchmark by 15% and the worst funds underperformed by 12%. Fears of a double dip recession plus the negative effects of the European sovereign debt crisis have negatively impacted the overall performance of the funds in this universe.
Of the top funds in our analysis a year ago, 7.69% remain in the top funds’ portfolio while 15.38% now make up the bottom funds’ portfolio this year; 23.08% of the funds in the portfolio either merged with another fund or were liquidated. Of the bottom funds a year ago, 13.3% remain at the bottom and 13.3% either merged with another fund or were liquidated. It must be noted that all funds have experienced a very marked increase in volatility on a rolling 12 week basis, roughly doubling since the start of July 2011.
We examine factors describing the best and worst performing funds on an aggregate basis. When funds are aggregated in a group, their common factors crystallize and specific bets are diversified away, which provides the basis for such an analysis. The analysis suggests that the top and bottom funds, on average, were exposed to different industry factors which can help explain their very diverse performance. Please note that our conclusions may change if a different timeframe is used to select the best/worst funds.
Selection of Top/Bottom Fund Groups
– Based on the universe of 286 funds, the total annualized performance is calculated during the last 52 weeks to rank the funds. Using the top 5% (15 funds) and bottom 5% (18 funds) equally weighted, daily rebalanced portfolios are created to try to identify why, on average, one group performed better in terms of style exposures.
– The top 5% funds’ cumulative returns are approximately 5.13% higher than the S&P 500 Index while the returns of the bottom 5% are 15.73% lower. In the chart below we include the results for the top funds and bottom funds as of our original analysis of December 2010. It is worth noting that the market volatility over the last 4 months has increased, and that the best funds, by successfully managing their risk, avoided the steep drop in performance suffered by the rest of the peer group.
– It appears that there the top funds of December 2010 managed to consistently remain above the median for the peer group over the last 52 weeks. These funds underperformed the benchmark starting in late July 2011, while outperforming in weeks prior to that. It appears as if the bottom funds of December 2010 would underperform their peers over the period analyzed, however, having an overall lower volatility than the rest of the funds, they managed to limit their losses and ended the 52 weeks outperforming close to 45% of their peers.
Chart 1: Cumulative Performance Chart

Returns-Based Style Analysis Highlights
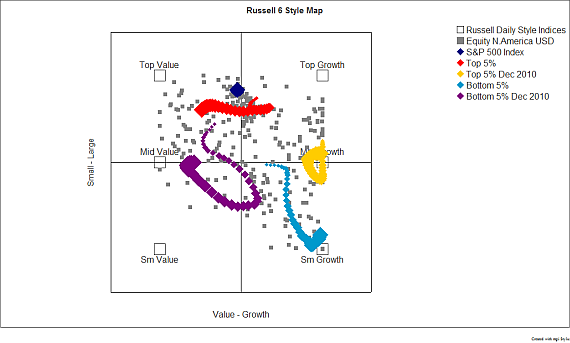
– Using style and capitalization factors, the first RBSA analysis suggests that, on average, the majority of the funds in the universe of 286 funds were exposed mostly to large caps, with a large number of them being exposed equally to growth and value. For those funds mostly exposed to small- and mid-caps, one can see that there was a bias towards growth. The style map shown in Chart 2 below also makes it clear that the top and bottom funds of this year and of 2010 were clearly exposed to different factors. The Top 5% fund behaves as a large cap blend, while the Top 5% 2010 was concentrated in mid growth. The Bottom 5% fund was biased to small caps with a heavy growth tilt, while the Bottom 5% 2010 had a mid-cap value bias.
Chart 2: Style Capitalization Factors – Style Map

– The second analysis performed using industry sectors (shown in Chart 3 below) as factors shows that the average RBSA style loadings for the peer universe is diversified with exposures across all industries. Cash and cash equivalent exposures make up a little over 6.5% and exposure to EAFE is close to 10%.
– When comparing these results to the results of the same analysis done last year (“North American Equity – USD Denominated Funds” December 2010), it becomes evident that the style exposures for the peer group are similar. On an aggregate basis, the peer group’s behaviour is consistent, with diversified exposures across all industry sectors, cash and cash equivalents, and MSCI EAFE.
– Using S&P 500 Industry Sector indices as well as the MSCI EAFE Index as factors, our RBSA analysis demonstrates that the top and bottom funds have exposures to different factors. As shown in Chart 3 below, the top funds had significant exposures to MSCI EAFE, and different S&P 500 sector indices: Industrials, Health Care, Consumer Staples, and Utilities. On the other hand, the bottom funds’ portfolio shows a limited exposure to MSCI EAFE, and large exposures to Financials and Materials sectors, which make up almost 54% of the total. The R Squared for each one of the regressions in our analysis is above 89.5%, which gives high credibility to our analysis.
– As expected, the benchmark displays no exposure to cash or cash equivalents, proxied by the Merrill Lynch 91 day T-Bill Actual Price Index. Comparing the exposures of the portfolio and benchmark helps us understand the excess performance sources for the top and bottom portfolios.
Chart 3: Universe, Funds’, and Benchmark Average Asset Loadings – Industry Factors

– Style attribution analysis shows that overweight exposures to the Industrials, Utilities, and Consumer Staples sectors together with underweight exposures to the Energy and Financials sectors are the main factors behind the top funds’ above average performance. Exposure to MSCI EAFE negatively impacted the top funds’ returns. On the other hand, all of the bottom funds’ excess exposures over the benchmark negatively impacted the overall performance. The most damaging overweight exposures were those to Materials and Financials.
Chart 4: Excess Return Contribution

Conclusions
Up until the first week of July 2011, North American Equity USD Denominated funds were performing very well, with only 3 of the 280 funds posting cumulative negative returns. After this date, North American Equity USD funds experienced a significant increase in volatility coupled with an overall drop in performance. The market’s volatility remained high until the first week of December; funds that successfully limited their volatility were able to reverse their fortunes and regain lost ground, with 170 funds in the peer group posting positive cumulative returns. The best performing economic sectors were Utilities (cumulative performance of 16.09%), Consumer Staples (13.03%) and Health Care (10.17%); these were favoured by the top funds which show overweight exposures and thus positive returns from these exposures. The bottom funds were underweight in these sectors but favoured financials and materials, which hurt their overall performance.
UNIVERSE DEFINITIONS & ASSUMPTIONS
• Database provider: Lipper, a Thomson Reuters Company
• Registered for sale countries: Austria, France, Germany, Italy, Netherlands, Offshore, Spain, Sweden, Switzerland, and the UK
• Filters: Primary share class, at least 1 year of performance history, Asset Type: Equity, Lipper Global Category: Equity North America, AUM: minimum USD 10 Million, Denominated in USD. Equity North America, as classified by Lipper, are “Funds with the primary objective to invest in Equity Markets of North America.”
• Number of funds analyzed: 286
• Date interval: Last 52 weeks starting on December 6, 2010 and ending on December 2, 2011
• RBSA Model: Locally Weighted Regression
• Currency: USD
• Analysis frequency: Weekly (with compounded daily data)
• Cash proxy (Risk Free Rate): Merrill Lynch 91 day T-Bill Actual Price Index
• Benchmark: S&P 500 Index
• Style factors: MSCI EAFE Index, S&P 500 Industry sector indices: Energy, Materials, Industrials, Consumer Discretionary, Consumer Staples, Health Care, Financials, Information Technology, Telecommunication Services, and Utilities.
• Analysis performed with mpi Stylus Pro™
Style Return: Return of the Best Fit Portfolio for the Manager Series, where the holdings of the portfolio are the Style Indices.
Selection Return: Calculated as the Manager’s Return subtracted by the Style Return. This is an indication of the Manager’s Selection or Stock Picking abilities.
Timing Return: Calculated as the Manager’s Style Return subtracted by the Benchmark’s Style Return. This indicates whether the Manager’s decisions, to over or under weight the style holdings, as compared to the benchmark, added to the portfolio’s return or not.
Style R Squared (R2): Measure of the model’s power in describing the Manager’s past behaviour in terms of style. The higher the Style R Squared value, the better the model’s explanatory power.
Predicted Style R Squared (PR2): Measure of the model’s power in predicting the Manager’s future behaviour in terms of style. The higher the Predicted Style R Squared value, the better the model’s predictive power.
Style Map: Graphic representation of the results of the Style Analysis. The series being analyzed are mapped unto a Cartesian plane, in which the X and Y axis represent exposures to different Styles and Sizes.
Asset Loadings: Weights of the Style Indices, as holdings, of the Style Portfolio, as calculated by mpi Stylus Pro.
——————————————————————————————————————————————-
Markov Processes International, LLC (MPI) is a global provider of investment research and technology solutions. MPI’s analytical tools and methodologies are employed by the finest institutions and financial services organizations to enhance their investment research, reporting, data integration and content distribution. MPI offers the most advanced platform available to analyze hedge funds, mutual funds, portfolios and other investment products, as well as asset allocation and portfolio optimization tools.
MPI’s Stylus Pro software is utilized by alternative research groups, hedge fund of funds, family offices, institutional investors, consultants, private banks, asset managers, diversified financial services organizations as well as marketing, product development and IT departments around the world. MPI also offers solutions for investment advisors and private wealth professionals. For more information on past MPI research articles visit http://markovprocesses.com/blog