

Global Tactical Asset Allocation (GTAA) funds, which seek to take advantage of changing market conditions while maintaining a globally diversified portfolio, have suffered recent underperformance, possibly driving withdrawals from the strategy. Considering the question of whether investors are bailing too soon, MPI was asked by Institutional Investor to look at some of the funds that have received the most interest from investors. However, the analysis of these funds can be difficult. GTAA funds do not have a readily available peer group to compare to, and invest in a variety of different assets. We created a customized peer group and performed quantitative analysis to shed light into this otherwise opaque category.
The funds consist of seven selected by II and an additional three chosen by MPI due to their size (AUM), institutional client base and/or reputation in the GTAA space. Nine of the funds are mutual funds, and are listed in the table below. The tenth is Bridgewater Pure Alpha, which is only available as a hedge fund.
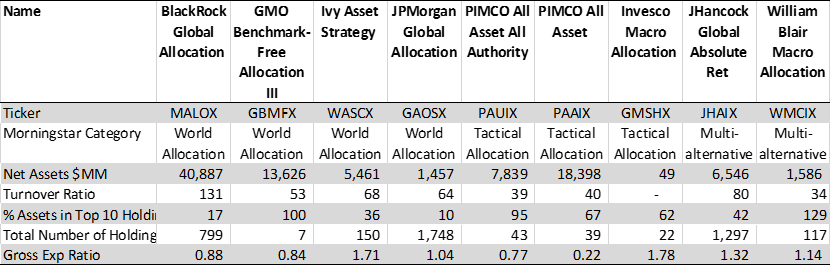
It is important to note that there is no defined GTAA category by Morningstar (M*) and that the nine products available as mutual funds are in 3 different M* categories; World Allocation, Tactical Allocation and Multialternative.
This is indicative of a more universal problem in clearly classifying GTAA funds. There are three related strategies with somewhat blurry lines to distinguish between them; Global (or World) Allocation, Global Tactical Asset Allocation and Global Macro. All three can be considered to have the same investment opportunity set. As a rule of thumb, we would expect Global Allocation funds to invest with long-term views, and not to shift rapidly between asset classes but rather to stay close to a strategic allocation. We would expect GTAA funds to try to capitalize on shorter-term market movements and/or mispricing, and have a more dynamic component to their exposures (hence, “tactical”). Global macro funds would also be expected to have a dynamic allocation but with a greater emphasis on both long and short positions, trade pairs and spreads and may have little to no discernible strategic allocation. However, some primarily strategic allocation funds make tactical bets. It is common for GTAA funds to hedge, use derivatives or take short positions. While an in-depth analysis of an individual fund should help solidify an opinion as to the strategy, it is difficult to define them as a category based on available objective screens. Therefore, before cataloguing our analysis, it is worth stating that investors would be well served to carefully consider each prospective fund and its manager(s).
Despite the difficulty in defining GTAA, we also look at the performance of a customized back-of-the-envelope peer group to provide comparative context for the 10 chosen funds. We chose to combine two Morningstar categories, World Allocation and Tactical Allocation. We filtered for active funds with at least 2 years’ history and at least $75 million in assets. In addition, the World Allocation category was filtered to only include those funds with stated annual turnover greater than the median of 60%. This was intended as a proxy to filter out the longer-view, less tactical funds. The Tactical Allocation category was filtered for funds with stated exposure of over 10% to non-US securities. This was intended to filter out funds without a global mandate (e.g., sector rotation; risk on, risk off). While this was a reasonable attempt to try and capture the spirit of GTAA funds within the framework of the data we have available, there are almost certainly funds that could be considered GTAA that were excluded and very likely at least some that would not generally be considered GTAA that were included. Additionally, with 2 of the 10 profiled funds belonging to the liquid alternatives Multialternative category, there are most certainly GTAA funds in other categories not included in our peer group.
Now, back to the ten selected products: These funds are a disparate group. Some, like BlackRock and GMO appear to lean more towards the Global Allocation with some tactical tilts. Others, like Invesco, John Hancock (subadvised by Standard Life Investments), William Blair and Bridgewater appear to tend towards the Global Macro end of the spectrum. They have a common available history of 51 months, which is what is used in the analysis and for performance statistics1. For context and understanding of how a fund is performing relative to benchmarks and peers, we’ve included two 60/40 benchmarks (one U.S. and one Global) and displayed them against the backdrop of the peer distribution.
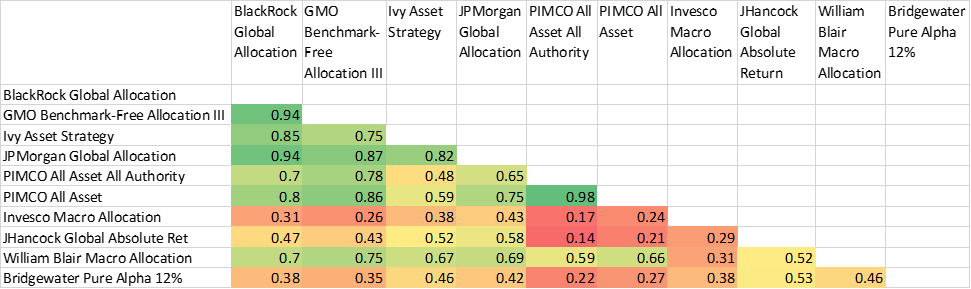
We start by looking at correlation of each fund to one another – see the correlation matrix below. Based on most of the funds’ generally low correlations to each other, we can expect further analysis to show them to be dissimilar. The two PIMCOs are highly correlated, as is BlackRock with GMO and JPMorgan. The rest fall into a range between moderately correlated to effectively uncorrelated.
Correlation, October 2012 – December 2016 (51 months of common history)
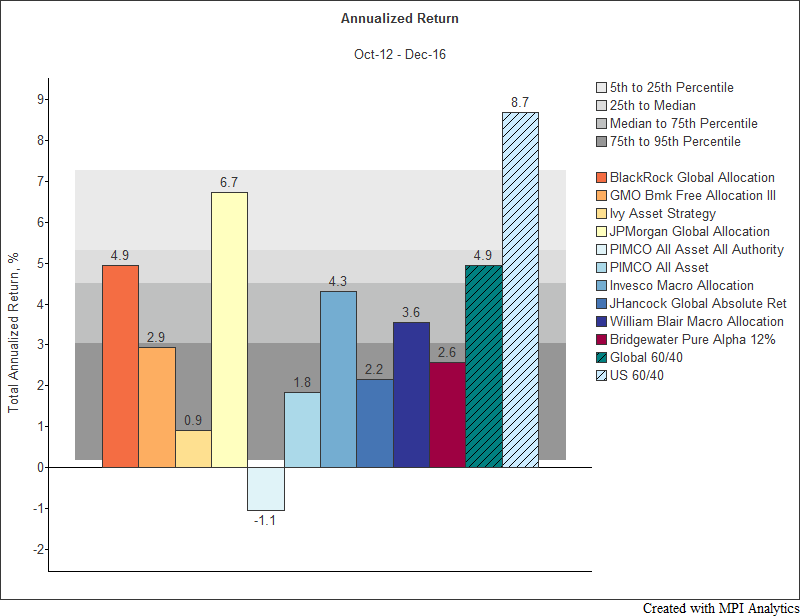
In terms of annualized performance over the common history (see chart below), we see representation in each quartile of the peer group amongst the 10 chosen funds, though half reside in the bottom quartile. Only BlackRock and JPMorgan outperform the peer median (see shaded rows in background representing category quartiles). The U.S. 60/40 outshines all of the funds and its Global counterpart; unsurprisingly since U.S. equities have been one of the biggest winners in the global arena over the recent period. Since GTAA funds should by definition be diversified across asset classes and geographies, they shouldn’t be expected to have kept pace with a Domestic 60/40 portfolio. The Global 60/40 performs slightly above the peer median, supporting its use as a (not unreasonable at least) benchmark.
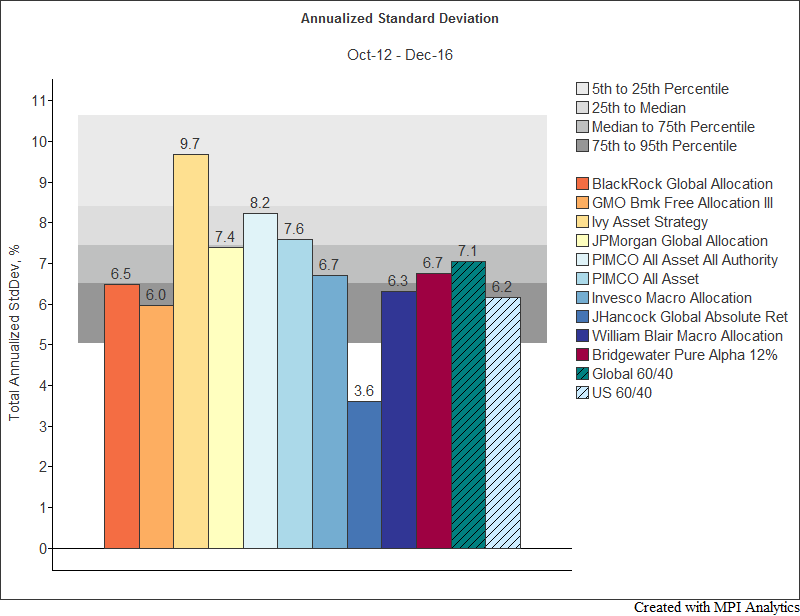
In terms of standard deviation (chart below), John Hancock Global Absolute Return Strategies (GARS, subadvised by Standard Life Investments) stands out as far less volatile than the rest, and Ivy significantly more. These two funds represent the extremes amongst the selected funds in terms of Max Drawdown as well, from -6.3% (JH GARS) to -21.3% (Ivy Asset Strategy). Most funds and both benchmarks are less volatile than the peer median.
The analysis below, using Dynamic Style Analysis (DSA; MPI’s patented model), was run using a factor map containing 13 global market indices plus the U.S. dollar index; the 13 indices are then “rolled up” into broad asset classes – Commodities, Global Equity and Global Bonds, in addition to the U.S. Dollar index. This method represents a trade-off between using a possibly too simplistic typical Allocation outline and an approach that lets the software identify more specific indices which are likely to be appropriate for some of the more complex products. The following chart shows the average perceived exposures to the factors used. It deliberately does not show cash exposure as it helps to see the overall market sensitivity of the fund more clearly.
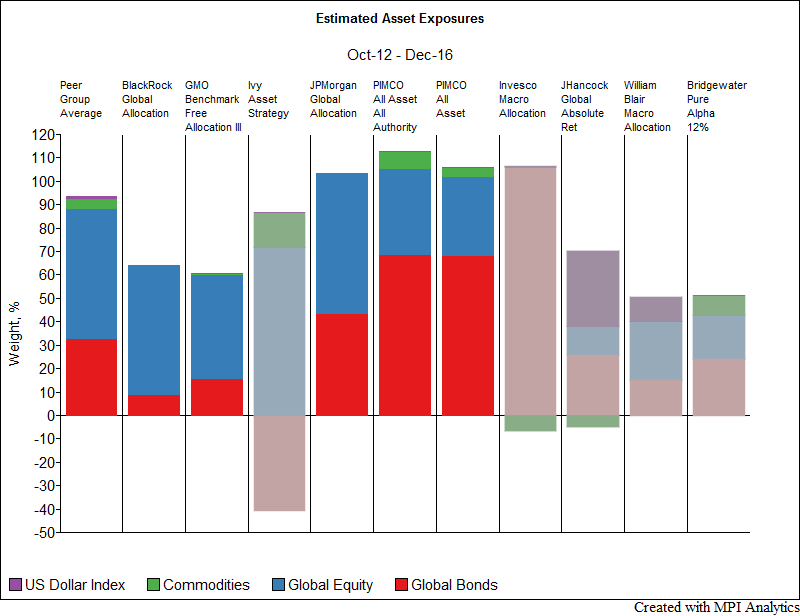
The predictive power for the analysis for five of the ten products (BlackRock, GMO, JPMorgan and both PIMCO products) is high3 and thus gives us confidence in those analyses. The remaining values, with the exception of Invesco are mediocre, meaning that we have some confidence in the sensitivities, but that on an individual basis we would want a deeper, more careful analysis and that we are likely missing some more specific factors when using this fairly broad global factor outline. The Invesco product has very poor predictive power and would definitely require more work. The fact that the same set of factors cannot reasonably be used for all of the products is yet another indication of the wide disparity in implementation. The exposures of the analyses in which we have less confidence and would, if analyzing them individually use a different factor set, are displayed in faded colors.
We would still comment that investors should be looking for diversification in an allocation fund, tactical or otherwise. Investors should be wary of funds that tends to appear particularly concentrated in any one asset group or trade, something we only observe for Invesco, our most unreliable analysis. You can see that these funds / strategies vary greatly in their implied market exposure – from about 50% to a little over 110% – and their allocations, even when rolled up to very broad asset classes, are quite different as well. Estimated net fixed income exposures range from less than 10% to the majority of the portfolio, with the reverse range present for equities. Net commodities exposure estimates range from positive to negative.
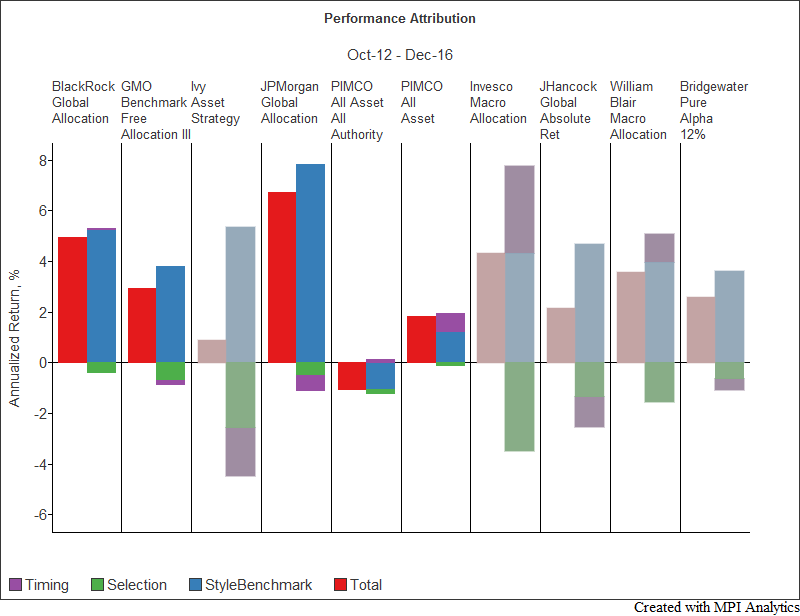
GTAA managers have the opportunity to add value across a number of dimensions, but their theoretical sources of value added naturally differ depending on the extent of their focus on strategic allocation, tactical allocation and security selection. In the performance attribution chart below, the Style Benchmark is representative of the return associated with the long-term asset allocation, while positive (or poor) tactical allocation choices are reflected in the Timing return, which is where the most of the “alpha” is expected to be derived in this type of strategy. The Selection4 returns are the returns that are unexplained by either the average Style (Style Benchmark) or the tactical allocations around it (Timing). If these had been compared to one of the 60/40 benchmarks rather than each fund’s average allocation, we would expect the timing portion to appear as a much larger proportion of the total return. The advantage of that approach is a transparent, objective and common benchmark, while the disadvantage is the inability to distinguish between the long-term and tactical components of the funds’ allocation as well as the mismatch between investment opportunity sets. The approaches are not mutually exclusive, and in a more in depth analysis both could have been used.
In terms of evaluating their performance attribution you can see that the five products whose analyses we are fairly confident in (i.e., BlackRock, GMO, JPMorgan and both PIMCO) derive the majority of their performance (which ranges between an annualized 6.7% and -1.1% over the common period) from their strategic allocation (Style Benchmark, blue), and that three add a little in terms of tactical movement around it (Timing, purple) while two detract, emphasizing the importance of the strategic portfolio allocation as well as the tactical.
Note also that the common evaluation period does not include any significant market stress, rather a bull market for US assets. We might expect to see more value added (or detracted) from tactical bets in more volatile markets. The analyses in which we have little confidence, (and therefore do not place credence in the performance attribution), are again shown as faded in the chart.
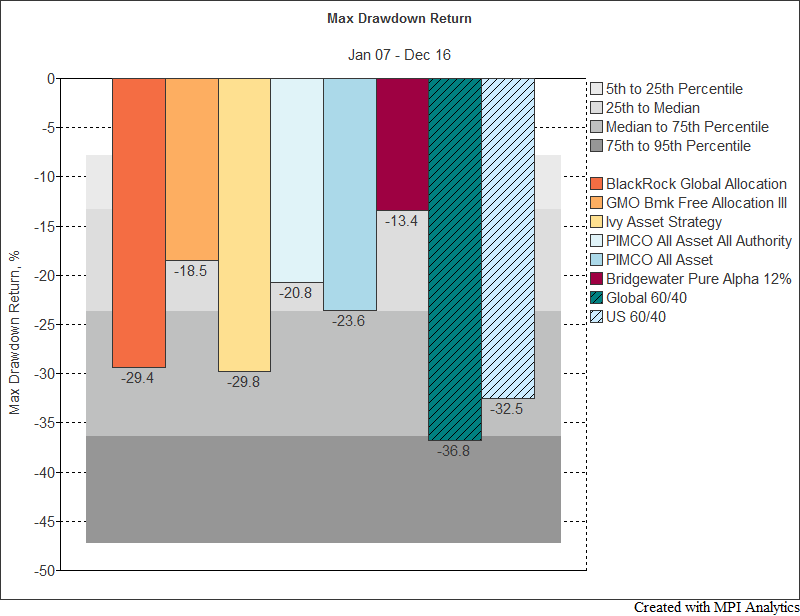
Only the worst quartile of funds had drawdowns at some point during the 10 years exceeding the Global 60/40 benchmark’s financial crisis drawdown. Most max drawdowns did take place during the financial crisis, but not all. Notably, of the funds specifically requested, neither PIMCO All Asset All Authority nor Bridgewater had its max drawdown during the financial crisis; both of theirs were within the past few years.
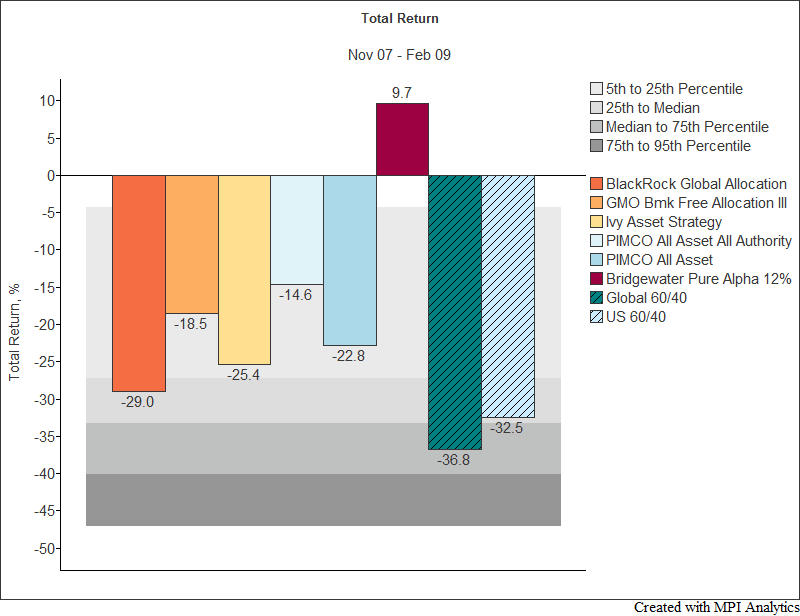
Another way to look at the funds’ ability to navigate the global crisis is to look at performance (Total Return, not Annualized) during the drawdown months that produced the -36.8% loss for the global portfolio (Nov 2007-Feb 2009). The obvious standout is Bridgewater, which produced a well-publicized positive return over the period, but all of the targeted funds lost less than the Global 60/40 portfolio, as did more than half the universe.
To recap, GTAA funds vary widely in approaches and outcomes. Due to the tactical nature of these strategies and the wide mandate investors give GTAA managers, as well as managers’ differing expectations for asset classes and geographical outlook, this dispersion is hardly surprising. Investors should carefully assess prospective managers and /or monitor current allocations, not only to peers and benchmarks but on an individual basis in terms of each fund’s strategic and tactical views to evaluate a manager’s decisions and success.
Footnotes
- 1For fund buyers looking at GTAA funds, it is recommended to review performance through periods of market stress, a fund’s track record permitting. In crises is when GTAA funds should be expected to provide most value due to their diversification and tactical navigation of market conditions and opportunities.
- 2DISCLAIMER: MPI conducts performance-based analyses and, beyond any public information, does not claim to know or insinuate what the actual strategy, positions or holdings of the funds discussed are, nor are we commenting on the quality or merits of the strategies. This analysis is purely returns-based and does not reflect actual holdings. Deviations between our analysis and the actual holdings and/or management decisions made by funds are expected and inherent in any quantitative analysis. MPI makes no warranties or guarantees as to the accuracy of this statistical analysis, nor does it take any responsibility for investment decisions made by any parties based on this analysis.
- 3All have a Predicted R-Squared, a proprietary cross-validation measure, value of over 90%
- 4Encompassing all unexplained returns, “Selection” may include components of security selection, missing factors or frictions in portfolio implementation including fees.