At the request of Leanna Orr, editor of With Intelligence and founder of The Allocator, we embarked on a project this year to estimate 2022 FY performance for major US university endowments. The challenge? Only annual endowment performance data is available, and because Q2 2022 private asset benchmarks aren’t yet published, we’ll have to project those as well.
This is not the first time we’ve tackled a project like this. Our MPI Eurekahedge 50 Tracker Index (BLOOMBERG: EHFI401), consisting of 25-30 liquid ETFs and priced daily, provides an estimate of what the TOP 50 hedge funds’ performance will look like – weeks before actual hedge fund data is available. (To create the Tracker ETF portfolio, we use monthly reported hedge fund returns as soon as they become available.)
Actual endowment results are set to start trickling in a few weeks from now, delayed primarily by valuations of the private assets that constitute a significant portion of large endowment portfolios. Many will argue that a lot depends on how aggressively private investments are marked down in the process.
And private investments are obviously a big part of the story. Let’s take a moment to recall what an incredible year 2021 was for most endowments, primarily driven by outsized valuations of private assets (private equity (PE) and venture capital (VC) in particular.)
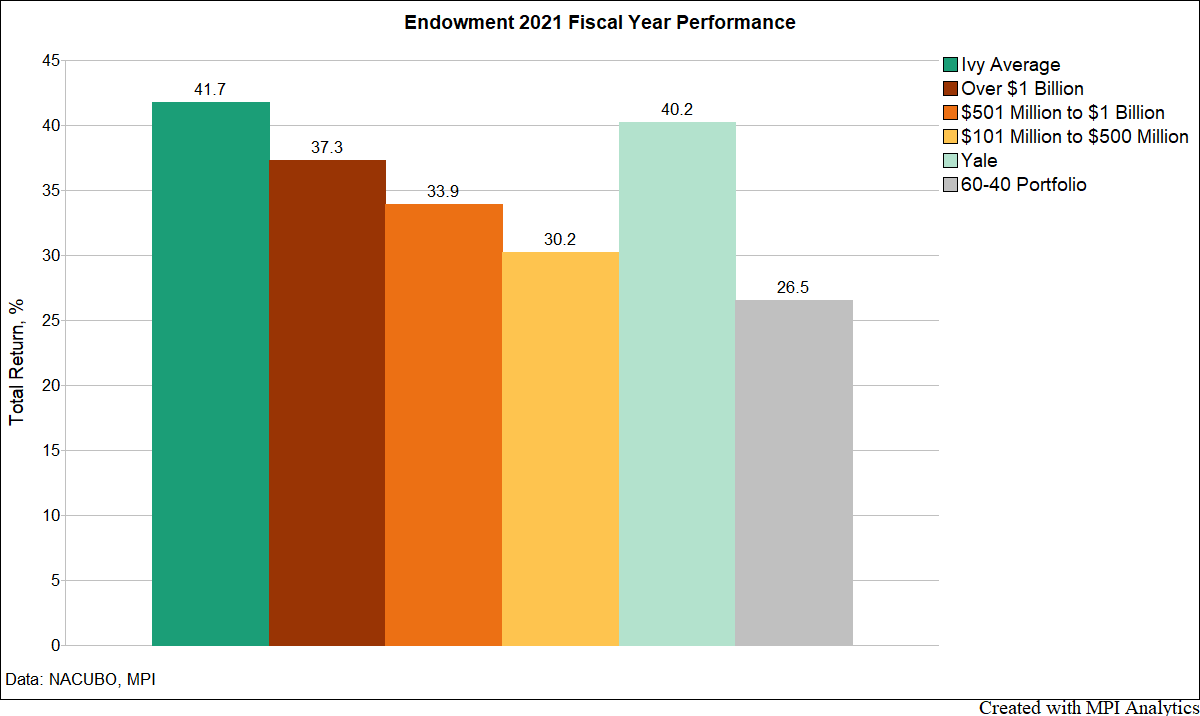
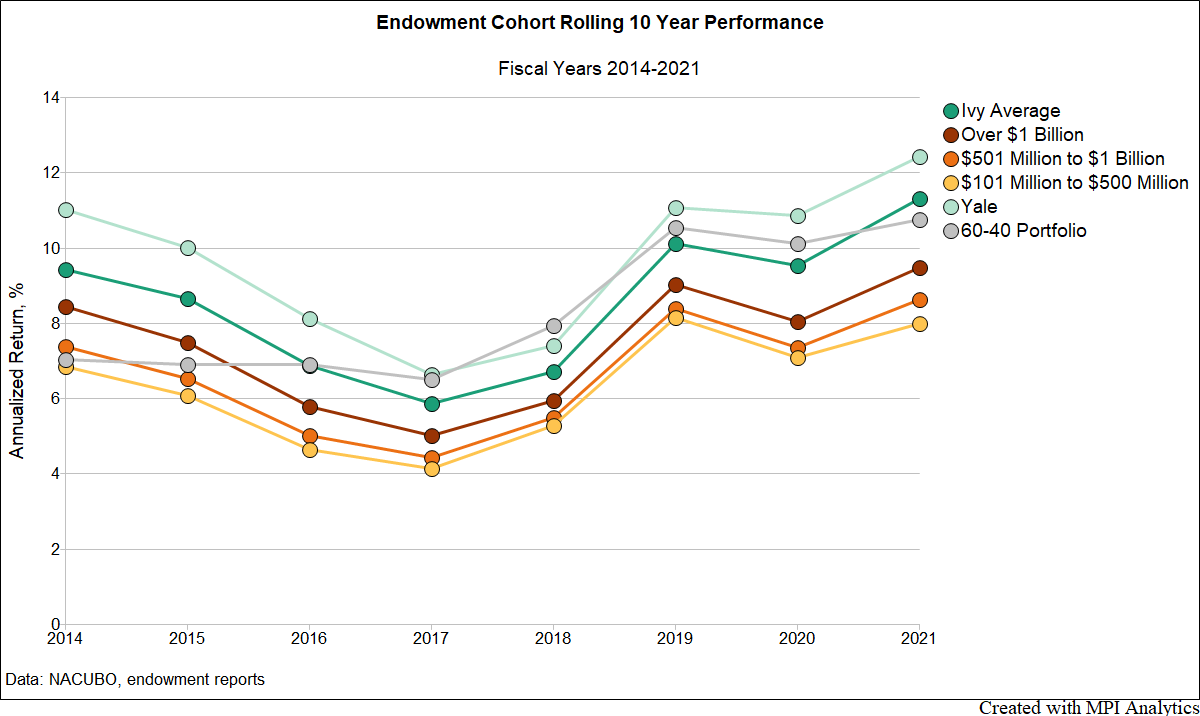
Below are FY2021 results for Ivy and NACUBO averages. Note that all groups shown here outperformed a domestic 60-40 portfolio. And on a 10-year basis (the second chart below), the Ivys’ average shrugged off the COVID crisis and came out ahead of the 60-40 after five years(!) of lagging. It was finally looking like the Ivys’ “winter of discontent” was behind them.
Asset Class Performance Projections
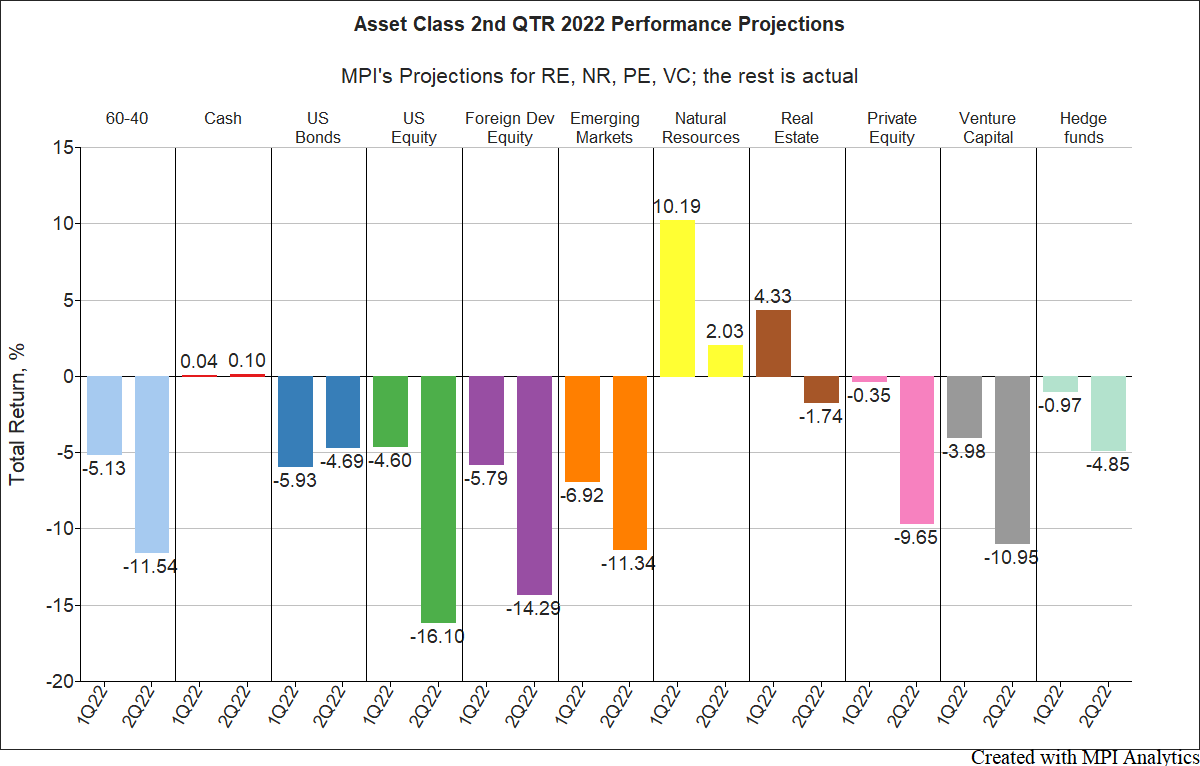
We start with estimating 2nd quarter performance for private assets, shown below. We used the MPI Stylus platform and our proprietary analytical models that are typically used to analyze private investments (such as Private Equity) with public equity factors. In this case, instead of a private fund we modeled indices. For PE, VC and RE, we used Cambridge Associates’ indices, and for Natural Resources, an index from Preqin.
Except for natural resources, we see negative performance across the board. PE and VC 2nd quarter returns are projected at -9.65% and -10.95%, respectively, significantly better than the S&P500 at -16.1%. (Remember, these are only projections; given a significant dispersion of PE/VC, especially in a year like this, the actual results could be different.)
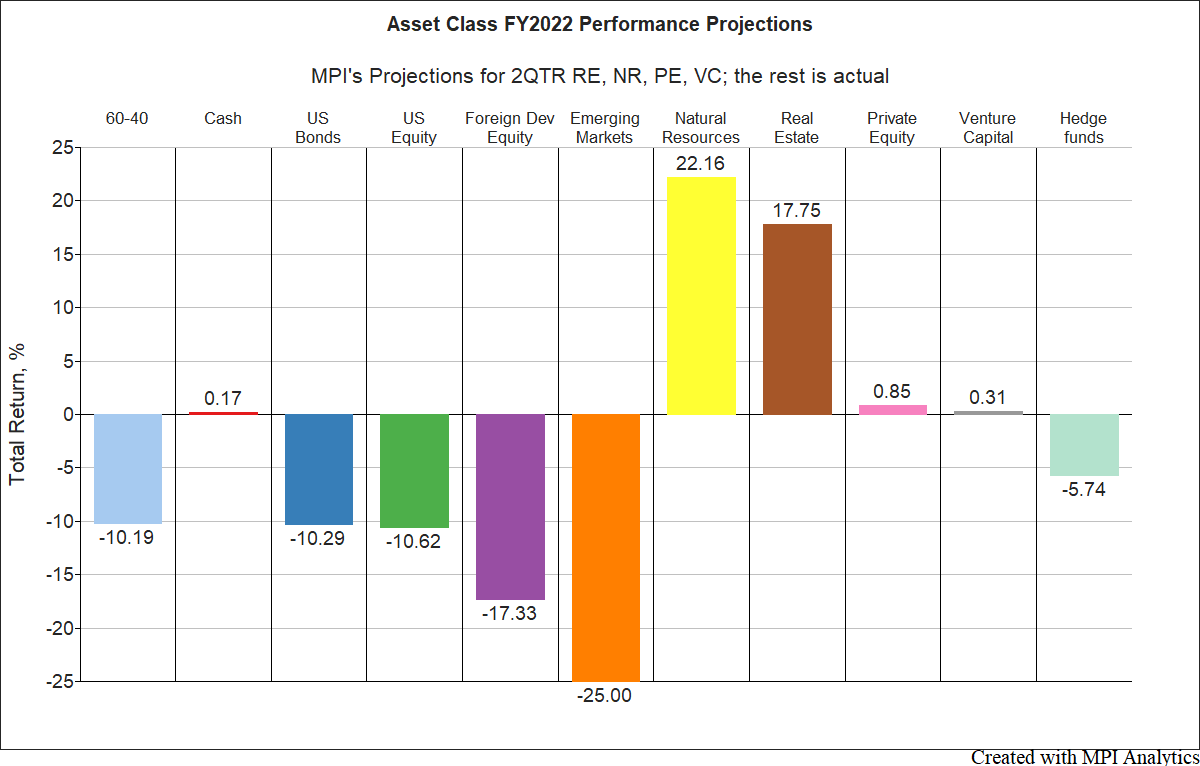
For the FY2022 we projected both PE and VC to have negligible returns. This could be viewed as good news, given a -10.62% loss for US Equities and the fact that only endowments overweighed in real assets would come out ahead. (As the HFRI FW Composite Index shows, FY2022 is also a dismal year for hedge funds.)
Estimating Exposures
Our next step was to estimate the latest exposures of endowments to asset classes. When only annual performance figures are reported, a decade’s worth of performance is represented by 10 data points. Such infrequent data leaves traditional static and rolling window methods of regression analysis struggling to find credible insights.
MPI’s Dynamic Style Analysis, however, is uniquely able to work with such limited data. DSA improves upon Sharpe’s original RBSA approach and, using factors indicative of the asset classes reported by endowments, provides significant insights into their behavior. DSA is able to explain changes in an endowment’s performance over time and to highlight differences across endowments using a common analytical framework.
It’s difficult to project individual endowment performance in a year with this many unknowns; therefore we will focus our analysis on endowment averages from NACUBO and the Ivy average, computed by MPI. We will then provide a glimpse of what an individual endowment result looks like by adding Yale to the group.
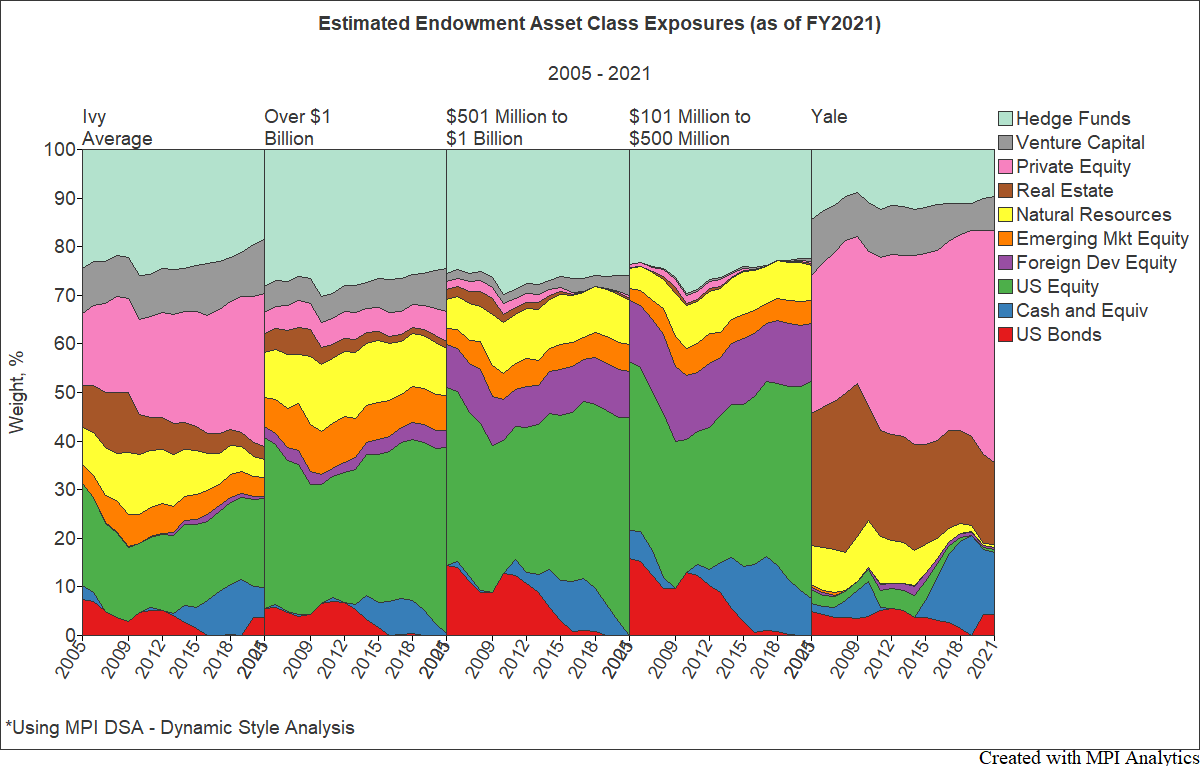
Below are the dynamic factor exposures captured by DSA using annual returns from July 2005 to June 2021 of various endowment categories.
For comparison, we provide below official reported allocations from the latest NACUBO report.
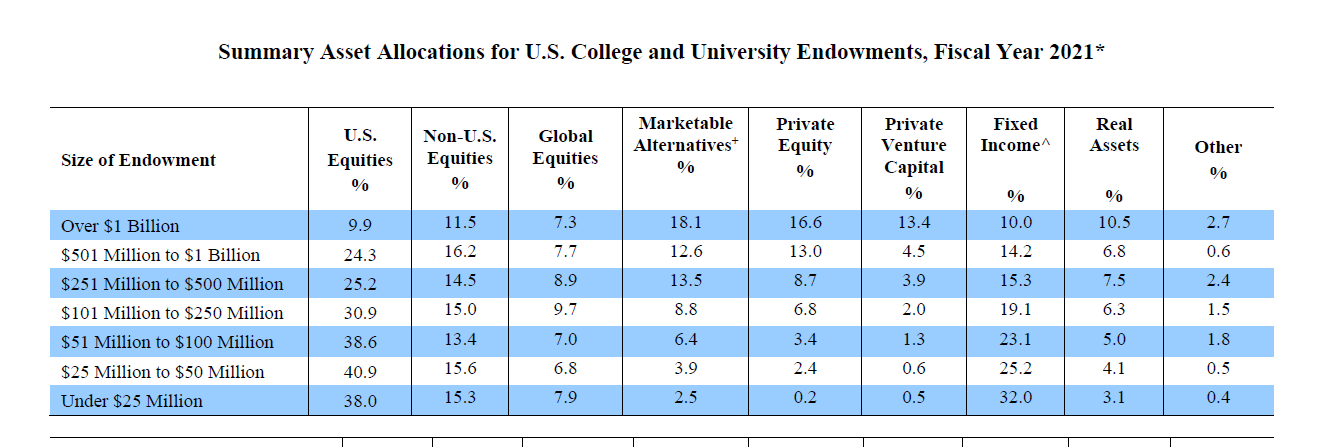
We see that for all three NACUBO sleeves, our analysis underestimates Private Equity and Venture Capital exposures, and overestimates exposure to US Equities. There are a few simple explanations for this.
Firstly, private equity returns become less stale and less serially correlated (behaving more like public equity) when aggregated annually. Secondly, we believe smaller endowments in particular invest in private equity more through diversified vehicles such as Fund of Funds, than through direct investment. And thirdly, when NACUBO averages are computed, they further diversify allocations by aggregating returns of many dozens of endowments.
Ivies, on the other hand, and especially Yale taken alone, represent a fairly concentrated allocation to privates – one where our system is able to detect the difference from the public asset behavior. (We do capture the tendency of larger endowments, Ivies in particular, being more exposed to private assets – the fact that we’ve covered before on these pages.)
Let’s also not forget that reporting standards differ between endowments when it comes to private assets and hedge funds. That’s why an analysis like ours is valuable; it provides a common denominator for comparison of what is actually driving an institutional portfolio’s returns. And that’s why we carefully term the output of our analysis as ‘exposures’ vs. ‘reported allocations’.
FY2022 Projections
Multiplying the latest asset class exposures (determined above) by the projected FY2022 returns, we’re ready to make our projections. In the chart below, we contrast FY2022 projections with FY2021 reported results.
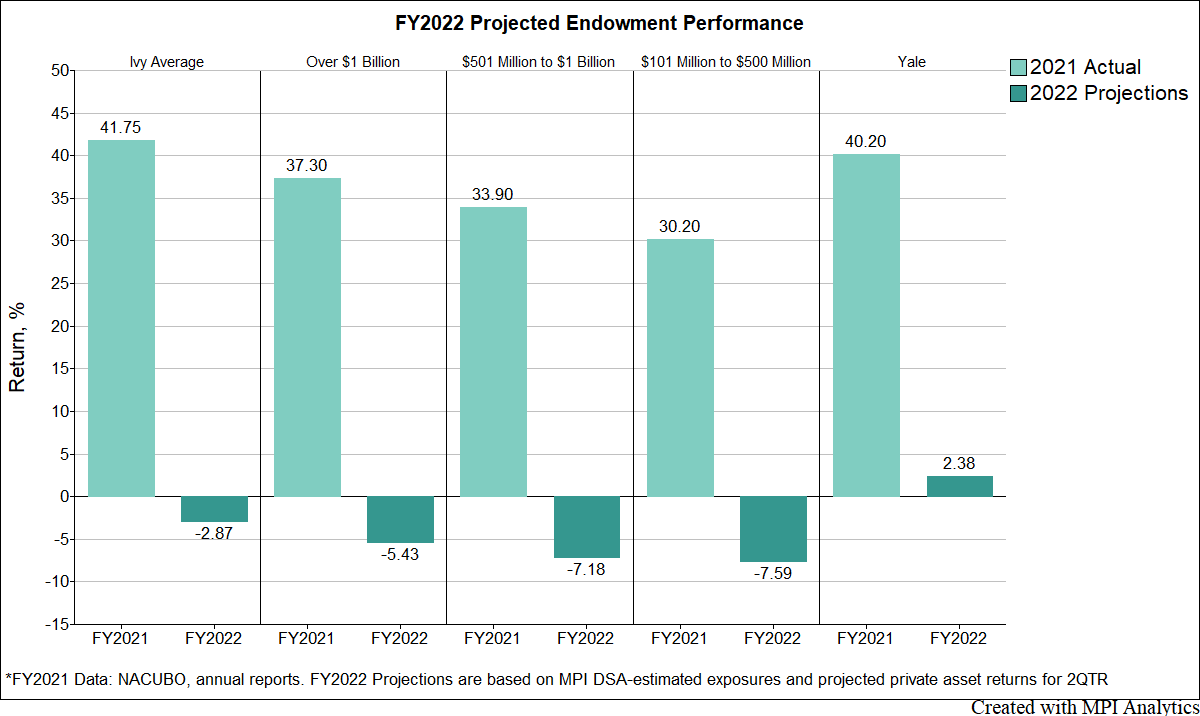
We project Ivies to be down this fiscal year but not as much as NACUBO sleeves. And Yale, with a 2.38% projected FY2022 return, gives a glimpse of what individual endowment performance might look like if it’s overweight in private equity and real estate.
One interesting observation is that the tendency is the same for both FY2021 and FY2022 projections: smaller endowments have lower returns, with Ivies towering over all others. We already wrote that the previous year’s returns were totally driven by PE and VC allocations, which are disproportionally high for larger endowments. The smaller the endowment, the larger their allocation to public equities (and lesser to privates). For private investments characterized by stale valuations, it will take several quarters to propagate the current market correction. While it’s happening, smaller endowments with portfolios reflecting the marked-to-market values will be lagging the larger ones.
We’ve said it already, but we’ll say it again. There are too many unknowns this year to rely on pure projections. But the rough approximations above do give CIOs valuable data points when they look to compare results with their peers.
Factors used in DSA Analysis:
- Cash & Equivalents – ICE BofA US 3-Month Treasury Bill Index
- US Bonds – Bloomberg Barclays Aggregate Bond Index
- US Equity – S&P 500 TR Index
- Developed Equity – MSCI EAFE USD Index
- Emerging Equity – MSCI Emerging Markets USD Index
- Natural Resources – Preqin Natural Resources Index
- Real Estate – Cambridge Associates Real Estate Index
- Private Equity – Cambridge Associates Private Equity Index
- Venture Capital – Cambridge Associates Venture Capital Index
- Hedge Funds – HFRI Fund Weighted Composite Index
DISCLAIMER:
MPI conducts performance-based analyses and, beyond any public information, does not claim to know or insinuate what the actual strategy, positions or holdings of the funds discussed are, nor are we commenting on the quality or merits of the strategies. This analysis is purely returns-based and does not reflect actual holdings. Deviations between our analysis and the actual holdings and/or management decisions made by funds are expected and inherent in any quantitative analysis. MPI makes no warranties or guarantees as to the accuracy of this statistical analysis, nor does it take any responsibility for investment decisions made by any parties based on this analysis.