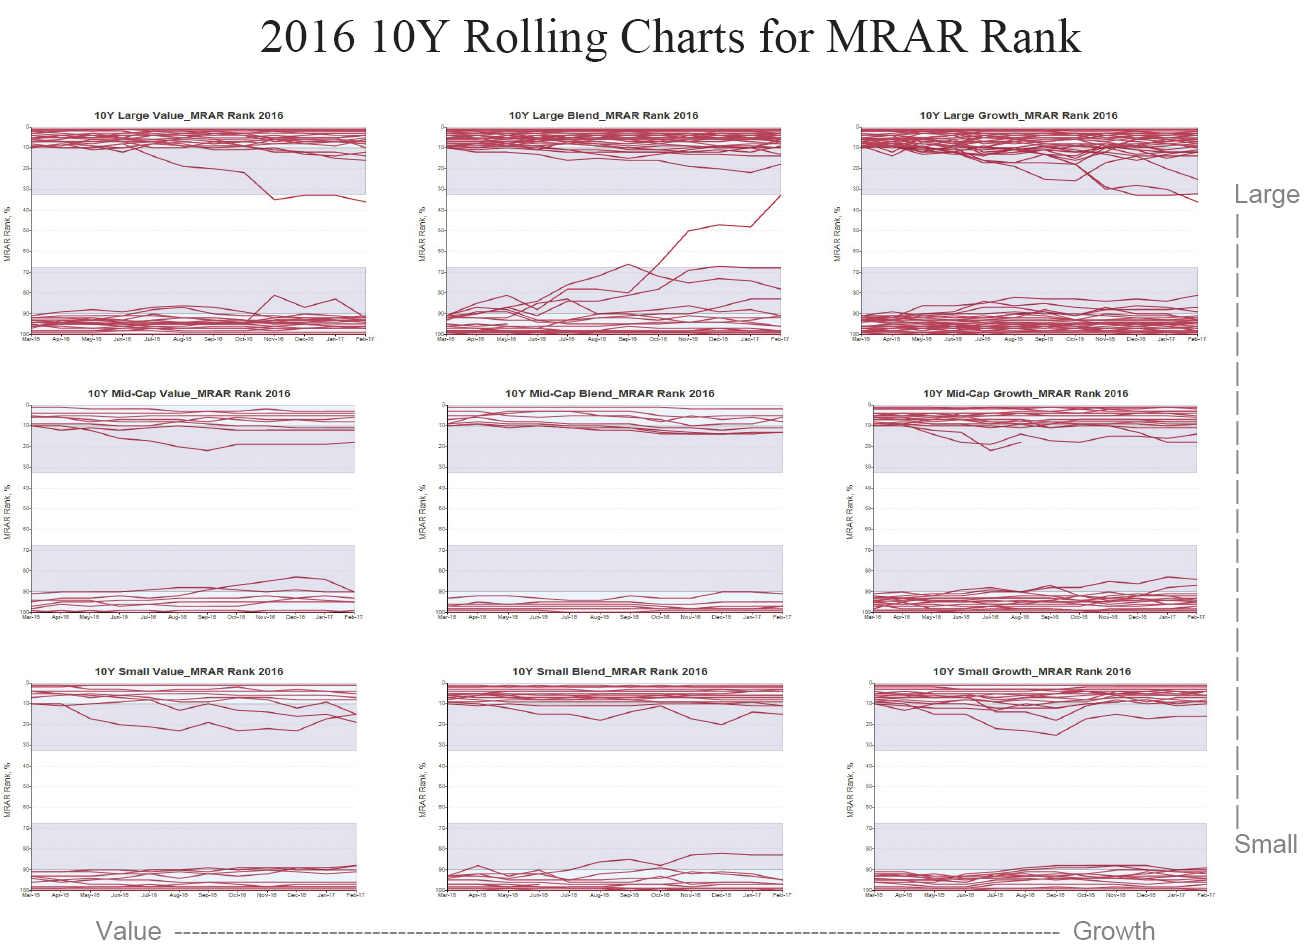
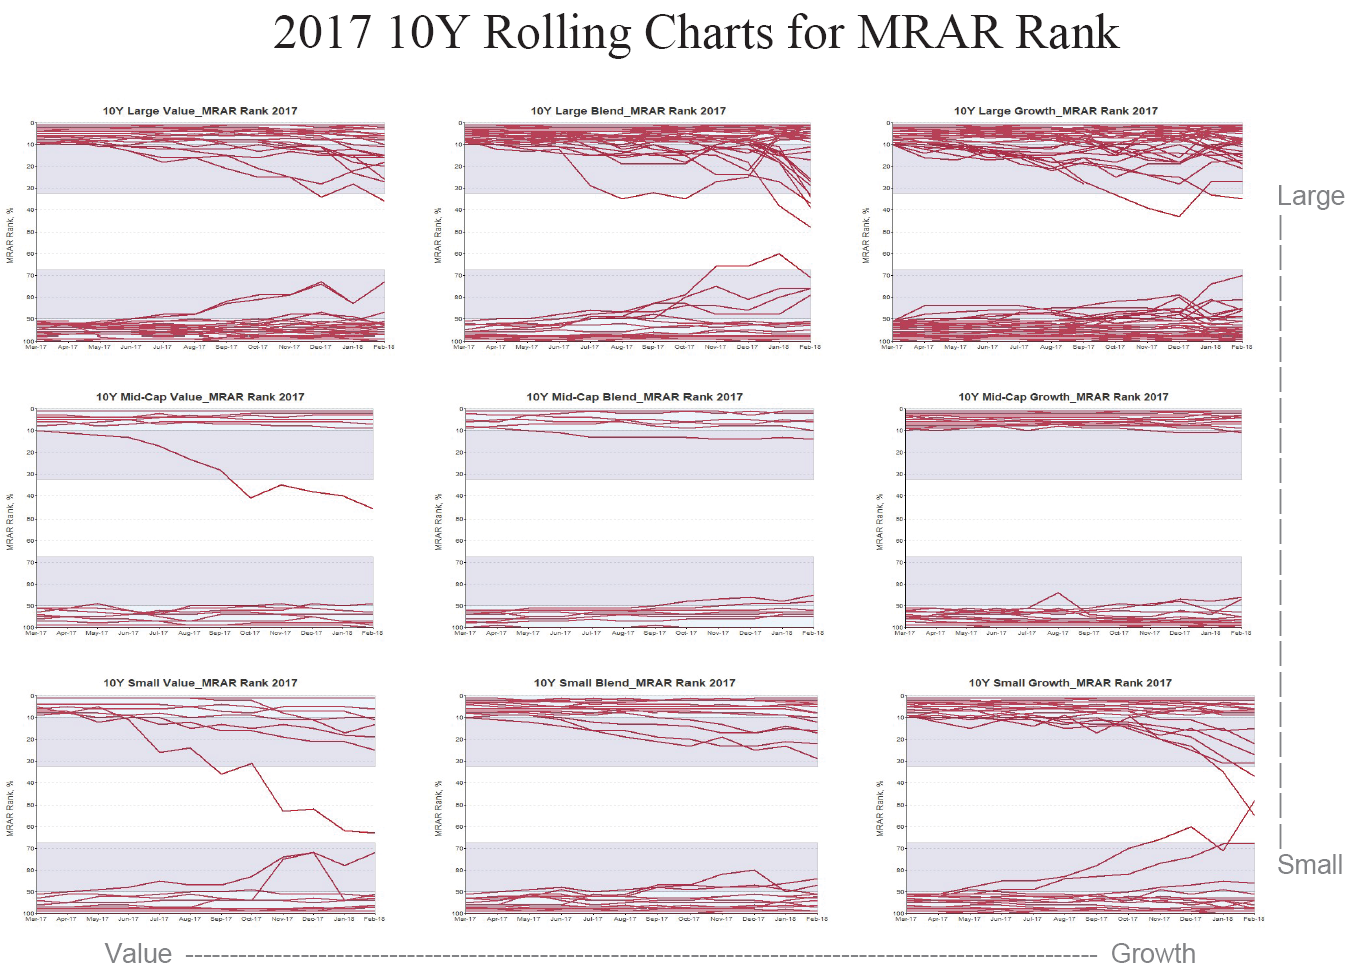
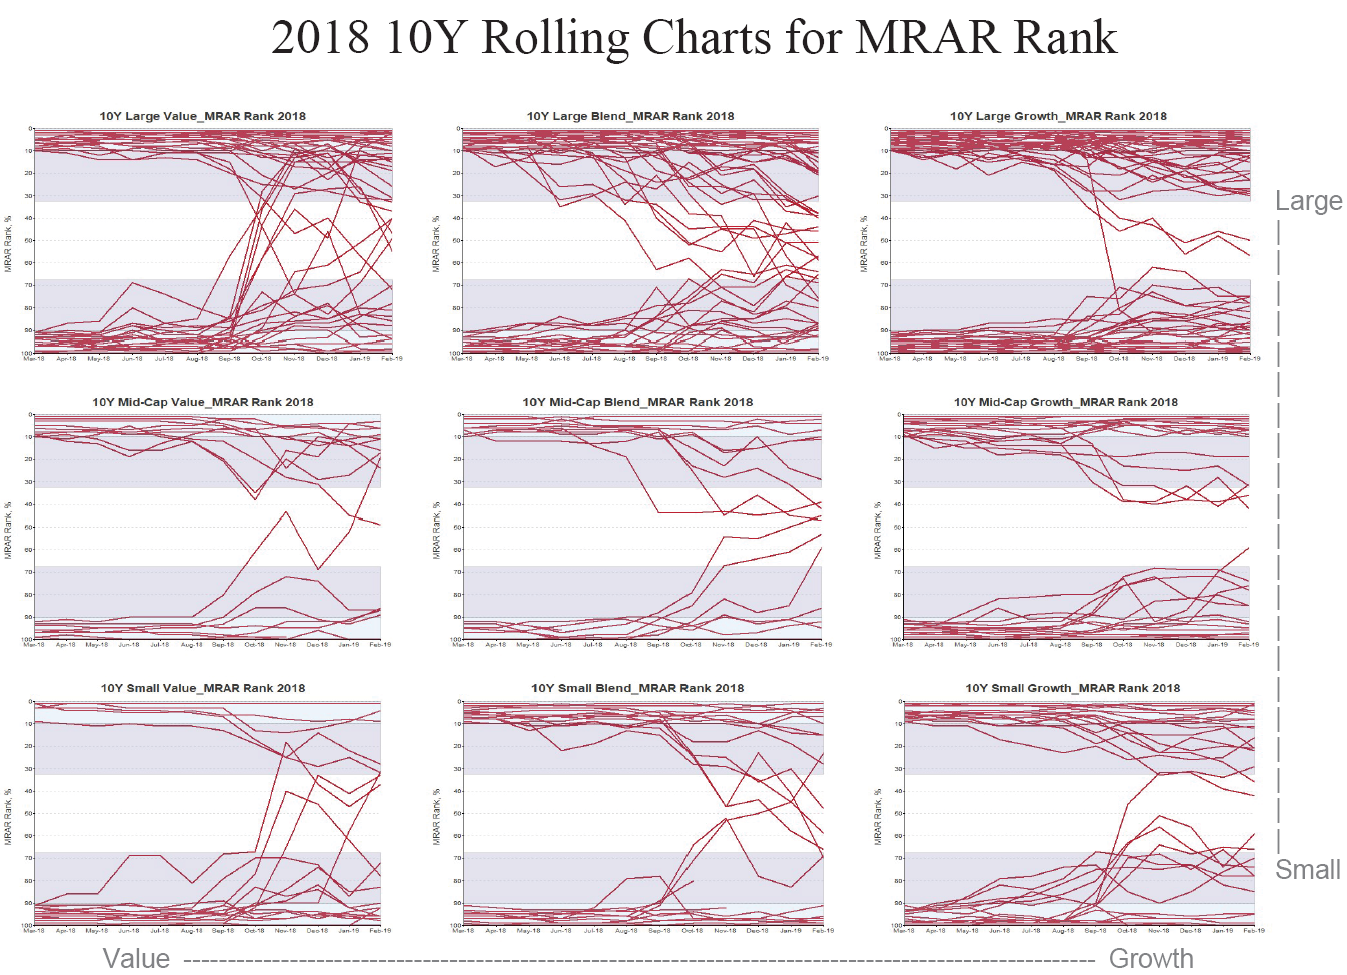
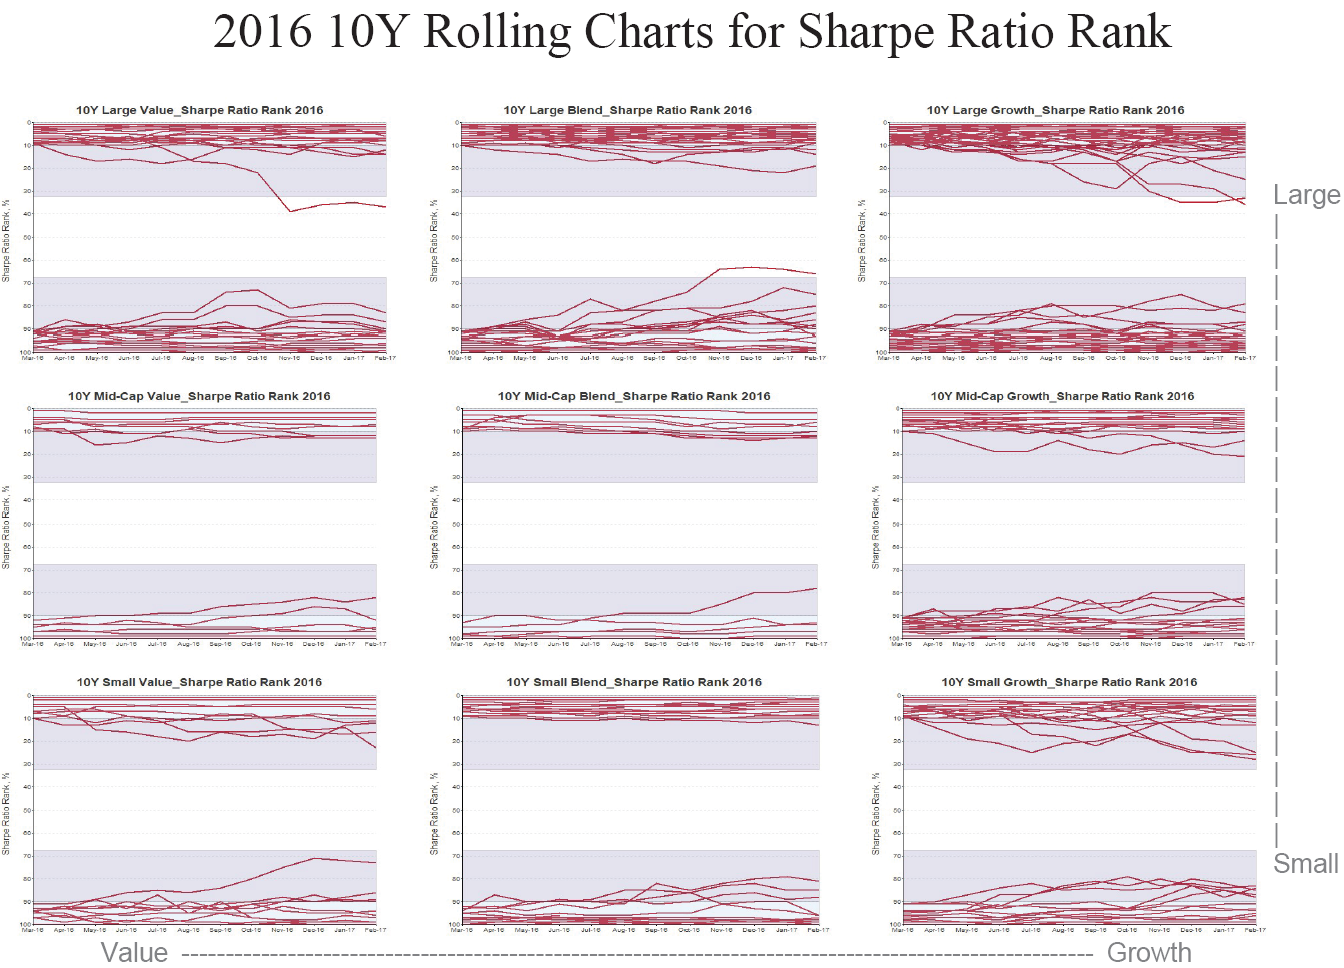
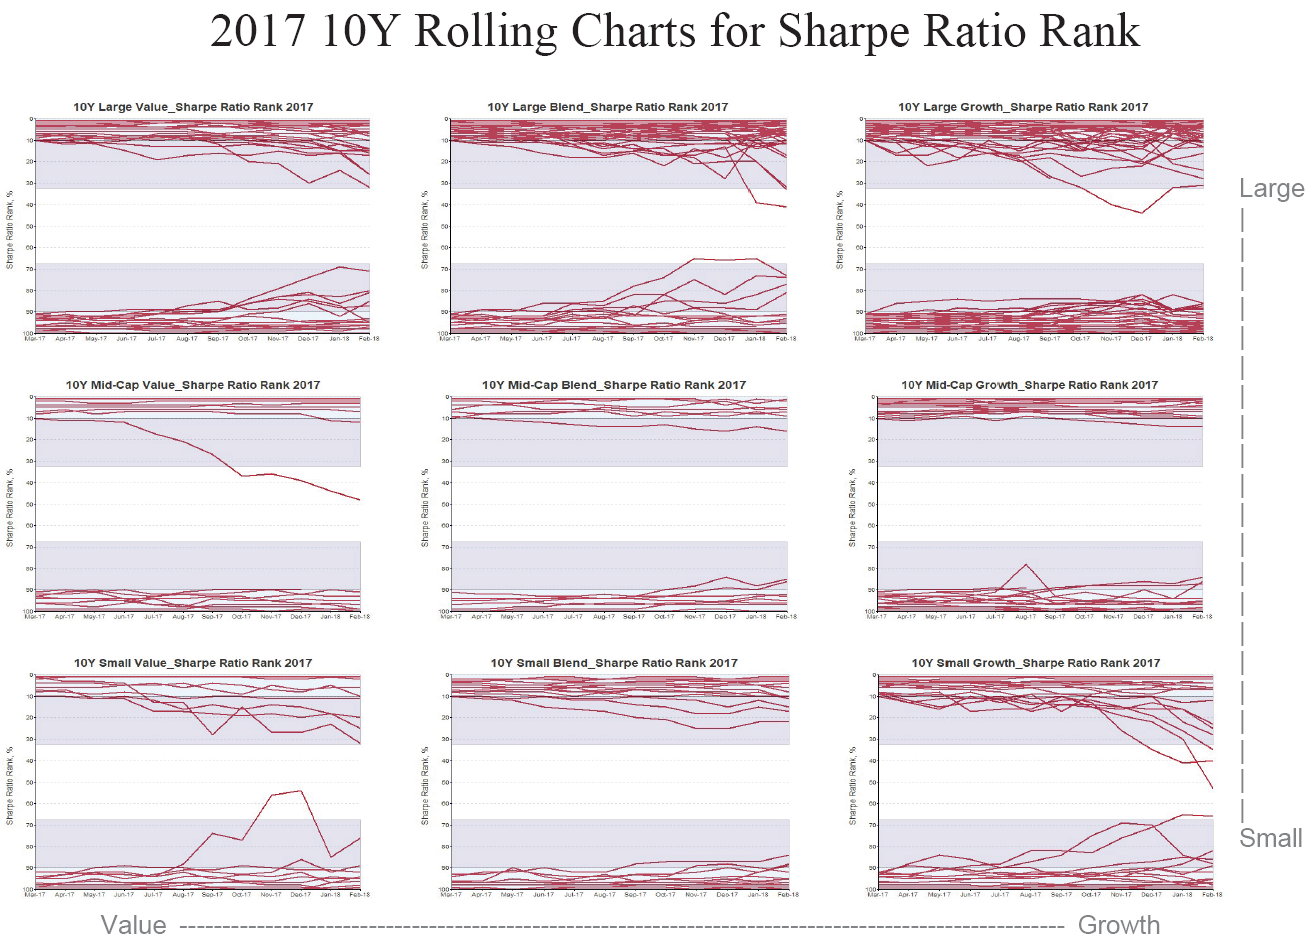
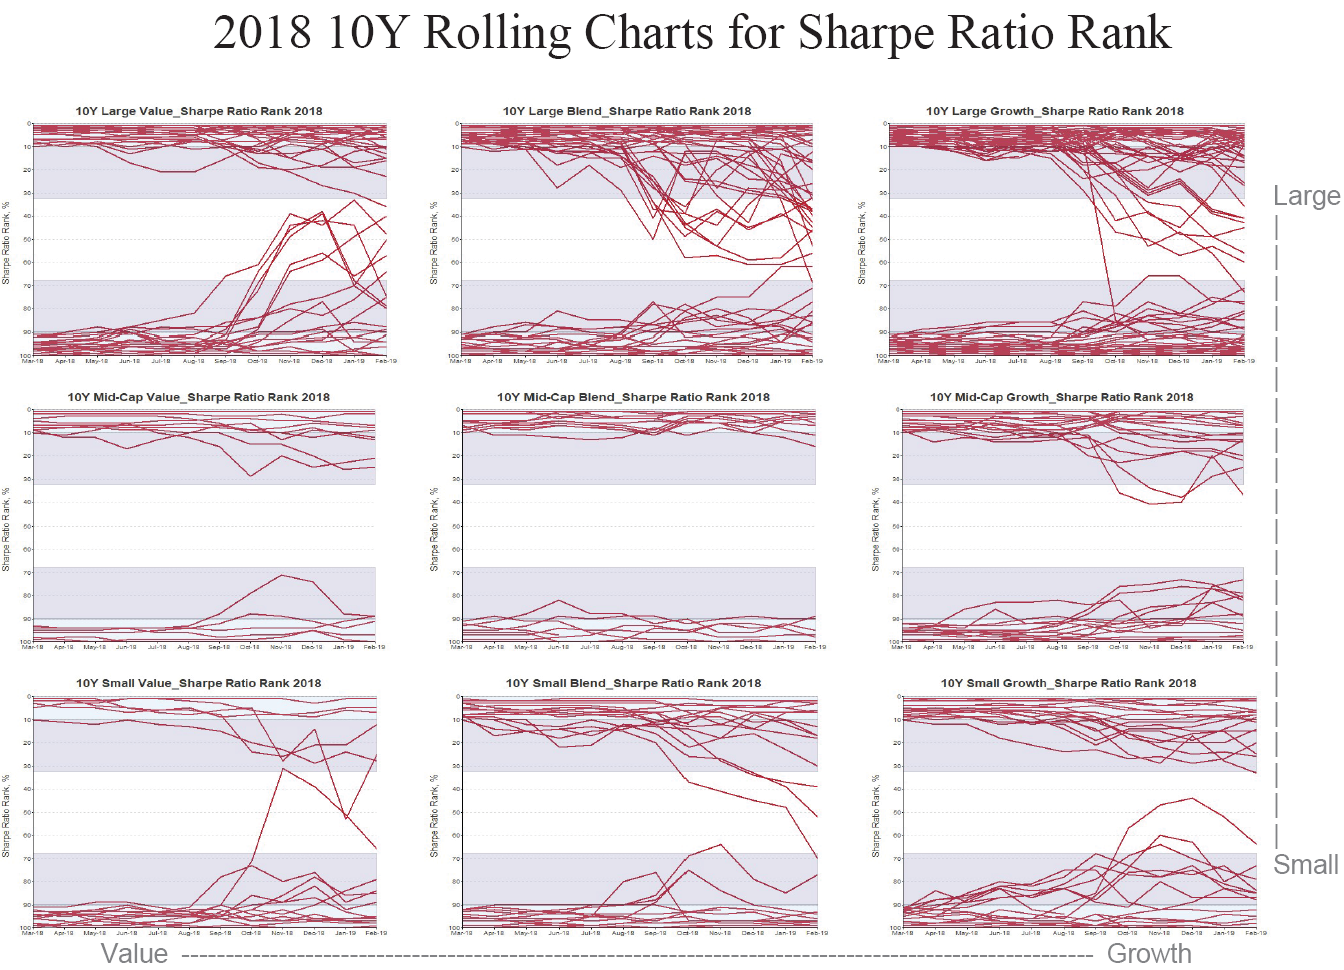
To demonstrate this trend, we take the top and bottom decile funds in each category as of March in each year (2016-2018). We then calculate the statistic ranking for each fund through the following year by rolling the 10-year window forward monthly.12
(This Appendix appeared in Shifting Stars: Fund Ratings Get Volatile as Financial Crisis Fades From the 10-Year Window)
Footnotes
- 1All share classes are ranked, only distinct share classes are plotted.
- 2DISCLAIMER: MPI conducts performance-based analysis and, beyond any public information, does not claim to know or insinuate actual strategy, positions or holdings of funds, portfolios or organizations discussed herein, nor are we commenting on the quality or merits of the strategies. This analysis is purely returns-based and does not reflect insights into actual holdings. Deviations between our analysis and the actual holdings, performance and/or management decisions made by funds and/or organizations are expected and inherent in any quantitative analysis. MPI makes no warranties or guarantees as to the accuracy of the statistical analysis contained herein. This analysis should not be interpreted as legal, tax or investment advice nor does MPI take any responsibility for investment decisions made by any parties based on this analysis. The use of this document is entirely at your own risk. Under no circumstances will Markov Processes International, Inc., and/or its affiliates, employees, third-party data providers and agents be liable for any losses, including but not limited to trading and investment losses, direct, indirect, incidental, consequential, special, exemplary, punitive, or any other monetary or other damages, fees, fines, penalties, or liabilities arising out of or relating in any way to this document, and/or content or information provided herein.