
Bond Global funds’ performances range from -8.83% to 42.73% over the last 52 weeks (ending July 29, 2011), in EUR terms. On average, the best 5% of the funds outperform the market (pegged to the Barclays Capital Global Aggregate Bond Total Return Index) by approximately 11.60% and the worst 5% underperform by approximately 3.88%. The top funds also display a lower volatility than the bottom funds and benchmark during this period. Click here to download the PDF.
We examine factors describing the best and worst performing funds on an aggregate basis. When funds are aggregated in a group, their common factors crystallize and specific bets are diversified away, which provides the basis for such an analysis. The analysis suggests that the top and bottom funds, on average, were exposed to different sector and duration factors which can help explain their very diverse performance. Please note that our conclusions may change if a different timeframe is used to select the best/worst funds.
Universe Overview – RBSA Analysis
– The universe is comprised of 268 funds that are classified under Lipper Global: Bond Global [1], with AUM of at least EUR 10 million and denominated in EUR. The analysis takes into account the performance of the Primary Share Class, as defined by Lipper.
– Using MPI’s Locally Weighted Regression algorithm, we apply Returns Based Style Analysis (RBSA) using mpi Stylus Pro to estimate the average exposures with weekly observations for the period from August 2, 2010 ending on July 29, 2011. We use Bank of America Merrill Lynch Global Broad Market fixed income indices as Style Factors.
– The average RBSA style loadings show that the peer universe is diversified with exposures across various maturities of corporate and sovereign bonds, as well as high yield instruments in USD and EUR. The highest exposure to Cash and equivalents, proxied by the EONIA index, is approximately 50%. The peer average displays approximate 16.45% hedged exposure to the US dollar which suggests that the average fund in the peer group did the same.
Selection of Top/Bottom Fund Groups
– Based on the universe of 268 funds, the total annualized performance is calculated during the last 52 weeks to rank the funds. Using the top 5% (14 funds) and bottom 5% (17 funds) equally weighted, daily rebalanced portfolios are created to try to identify why, on average, one group performed better in terms of style exposures.
– On a cumulative basis, over the period analyzed, the top 5% of funds outperform its peers, benchmark and the bottom 5%. Returns of the top 5% are approximately 11.60% above the Barclays Capital Global Aggregate Bond TR Index while the returns of the bottom 5% are 3.88% below. The peer group’s performance appears to be on a fairly stable path over this period.
– The top funds consistently outperformed their peers and the benchmark with an overall volatility, as defined by the annualized standard deviation, of 2.16%. This value is lower than that of the benchmark (8.10%) and bottom funds (5.06%). The Information Ratio is 1.43 for the top funds versus -1.00 for the bottom funds.
Chart 1: Cumulative Performance Chart

Returns-Based Style Analysis Highlights
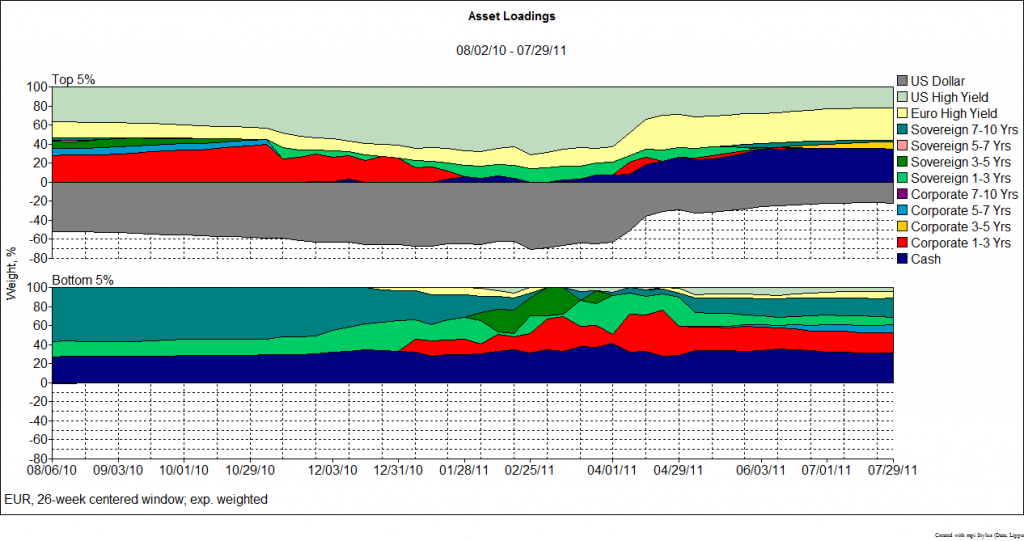
– Using sector and duration indices as factors and the US Dollar as a hedge instrument, our RBSA analysis demonstrates that the top and bottom funds have different style exposures. The top funds’ negative weight to the US Dollar indicates that these funds hedge up to 50% of their exposure to the US Dollar, which is close to their 45% US High Yield exposure. On the other hand, the bottom funds do not hedge their exposure to the US Dollar and have very small exposures to US (2.02%) and EUR (2.54%) High Yield. Overexposure to US and EUR High Yield and hedging for adverse USD currency movements allows the top funds to outperform the bottom funds. Given that the USD depreciated by approximately 9.77% [2]against the EUR, over the period analyzed, the top funds’ hedges protected their performance while the bottom funds’ performance was negatively impacted.
– We can verify that our returns based style analysis results are in line with the holdings-based analysis. The top 10 holdings of the funds within the top 5% portfolio illustrate that these funds are mostly exposed to high yield instruments, short term corporates and a small portion of cash and equivalents. The bottom 5% portfolio is mostly exposed to longer-dated sovereign bonds and cash and equivalents. The downside exposure to the US Dollar suggests that the top funds hedged their exposure to currency risk, which the bottom funds did not do.
– As expected, the benchmark displays no exposure to cash or cash equivalents, proxied by the EONIA Index. Comparing the exposures of the portfolio and benchmark helps us understand the excess performance sources for the top and bottom portfolios.
Chart 2: Universe, Funds’, and Benchmark Average Asset Loadings

– The Style return represents what a manager following a passive (ie. Beta) strategy would have generated. When the Style return is lower than the manager’s return, meaning positive selection returns, one can infer that the manager’s active return is positive. Selection tends to be higher when funds are highly concentrated, such as the bottom 5%, which are mostly exposed to sovereigns. As a group, the top 5% display positive selection (2.88%) and timing (8.37%) skills, whereas the bottom 5% show negative selection (-4.12%) and timing (-0.11). Selection and timing returns represent components of excess benchmark performance.
– Style attribution analysis can clarify if over- and under-exposures to different styles (versus the benchmark) aided or hindered the funds. Overall, the over- and under-weight exposures suggest that if the bottom funds pursued a passive investment approach (with holdings in the same proportions as their style exposures) they should have underperformed the benchmark by approximately 24bps (not the given 3.88%). As depicted by Chart 3, the top funds’ hedged exposure to the USD and overexposure to US and EUR High Yield allowed them to outperform their peers. Having an overexposure to Cash impaired the top funds. On the other hand the bottom funds were consistently overexposed to Cash by slightly over 20%, which helped the group generate some excess return over the benchmark. The bottom funds’ lack of hedging did not protect them from a depreciating USD.
Chart 3: Excess Return Contribution

Chart 4: Dynamic Asset Loadings

Conclusions
Funds within the Bond Global universe illustrate large dispersions in performance which can be explained by the managers’ specific style bets and use of derivatives to limit currency risks. The hedged exposure of the funds in the peer group ranges from funds with no hedged exposure to funds hedging close to 82%. The best performing funds exhibited a larger hedged USD exposure than the worst performing funds. During this period, the USD depreciated against the EUR which allowed the best performing funds to avoid a partial drop in performance of their USD denominated holdings, especially US High Yield. The best performing funds had very large exposures (close to 65%) to high yield instruments, whereas the worst performing funds had an exposure of close to 4.5%. Exposures to sovereign bonds negatively impacted the funds’ performance.
UNIVERSE DEFINITIONS & ASSUMPTIONS
- Database provider: Lipper, a Thomson Reuters Company
- Registered for sale countries: Austria, France, Germany, Italy, Netherlands, Offshore, Spain, Sweden, Switzerland, and the UK
- Filters: Primary share class, at least 1 year of performance history, Asset Type: Bond, Lipper Global Category: Bond Global, AUM: minimum EUR 10 Million, Denominated in EUR.
- Number of funds analyzed: 268
- Date interval: Last 52 weeks starting on August 2, 2010 and ending on July 29, 2011
- RBSA Model: Locally Weighted Regression
- Currency: EUR
- Analysis frequency: Weekly (with compounded daily data)
- Cash proxy (Risk Free Rate): EONIA Index
- Benchmark: Barclays Capital Global Aggregate Bond Total Return Index
- Style factors: Bank of America Merrill Lynch Broad Market Corporate 1-3 Yrs, 3-5 Yrs, 5-7 Yrs, and 7-10 Yrs; Bank of America Merrill Lynch Global Sovereign Broad Market Plus Index 1-3 Yrs, 3-5 Yrs, 5-7 Yrs, and 7-10 Yrs; Bank of America Merrill Lynch Euro High Yield Total Return Index, and Bank of America Merrill Lynch US High Yield Master II Total Return. The USD is used as a Hedge Factor.
- Analysis performed with mpi Stylus Pro™
Style Return: Return of the Best Fit Portfolio for the Manager Series, where the holdings of the portfolio are the Style Indices.
Selection Return: Calculated as the Manager’s Return subtracted by the Style Return. This is an indication of the Manager’s Selection or Stock Picking abilities.
Timing Return: Calculated as the Manager’s Style Return subtracted by the Benchmark’s Style Return. This indicates whether the Manager’s decisions, to over or under weight the style holdings, as compared to the benchmark, added to the portfolio’s return or not.
Style R Squared (R2): Measure of the model’s power in describing the Manager’s past behaviour in terms of style. The higher the Style R Squared value, the better the model’s explanatory power.
Predicted Style R Squared (PR2): Measure of the model’s power in predicting the Manager’s future behaviour in terms of style. The higher the Predicted Style R Squared value, the better the model’s predictive power.
Style Map: Graphic representation of the results of the Style Analysis. The series being analyzed are mapped unto a Cartesian plane, in which the X and Y axis represent exposures to different Styles and Sizes.
Asset Loadings: Weights of the Style Indices, as holdings, of the Style Portfolio, as calculated by mpi Stylus Pro.
——————————————————————————————————————————-
Markov Processes International, LLC (MPI) is a global provider of investment research and technology solutions. MPI’s analytical tools and methodologies are employed by the finest institutions and financial services organizations to enhance their investment research, reporting, data integration and content distribution. MPI offers the most advanced platform available to analyze hedge funds, mutual funds, portfolios and other investment products, as well as asset allocation and portfolio optimization tools.
MPI’s Stylus Pro software is utilized by alternative research groups, hedge fund of funds, family offices, institutional investors, consultants, private banks, asset managers, diversified financial services organizations as well as marketing, product development and IT departments around the world. MPI also offers solutions for investment advisors and private wealth professionals. For more information on past MPI research articles visithttp://markovprocesses.com/blog/