Endowment performance reports are streaming in, so it’s time for MPI to continue our long tradition of analyzing some of the largest and most important university endowments.
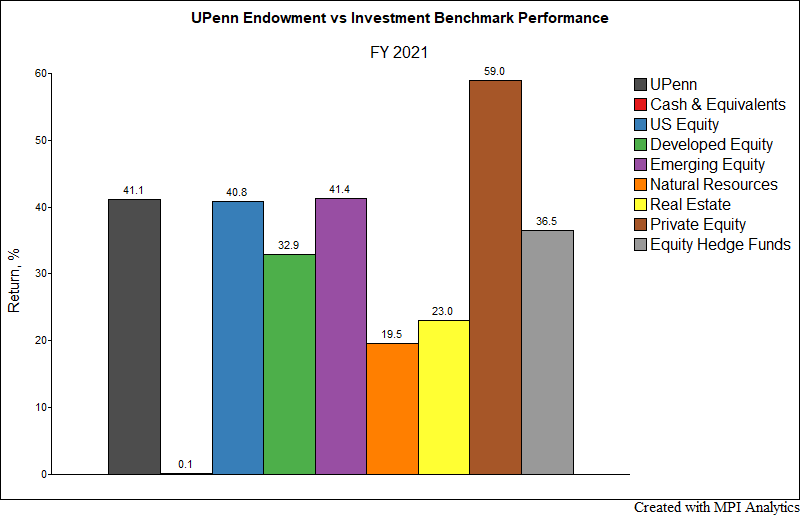
First up is the University of Pennsylvania, the first ivy league school to report its performance. The $20.5 Billion endowment posted a return of 41.1% for FY 2021, driven by strong returns in private equity and venture capital. This represents a 3.1% outperformance of their blended composite benchmark (composition undisclosed).
Research teams that want to explore the drivers of performance and risk at these endowments face a number of challenges. First, only annual returns are made public, leaving analysts with far too few observations for traditional static and rolling window regression methods to produce meaningful results. Secondly, definitions of asset classes and their proxies varies wildly between schools, especially when it comes to alternatives – the focal point of most Ivy endowments’ portfolios. This makes it difficult to establish a common framework for analyzing and comparing results based on reported allocations alone.
This is where factor modeling plays crucial role – by establishing a “common denominator” in explaining and comparing performance drivers of investment portfolios – whether equity or fixed income mutual funds, Target Date Funds, hedge funds, or macro-level portfolios such as endowments or pensions. Using our Dynamic Style Analysis (DSA) model, we worked to create a dynamic portfolio of investment benchmarks that predictively mimic the annual return of UPenn’s endowment portfolio based on their annual returns since 2005. (You can see the results in the chart below).
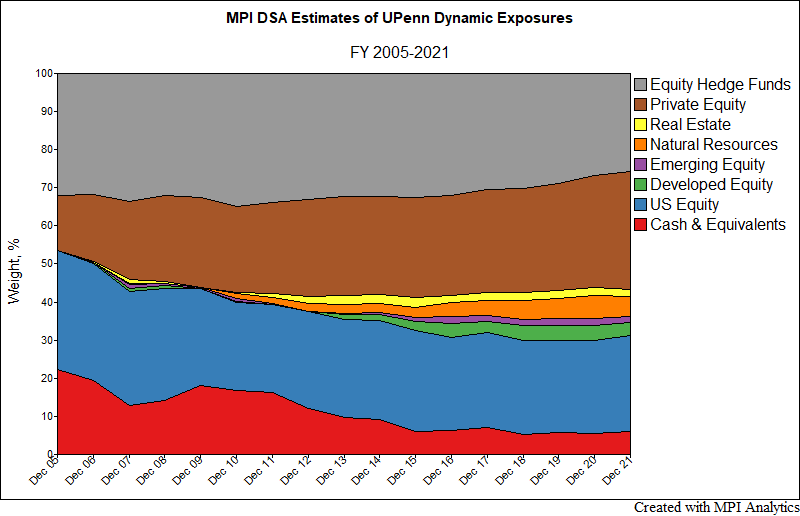
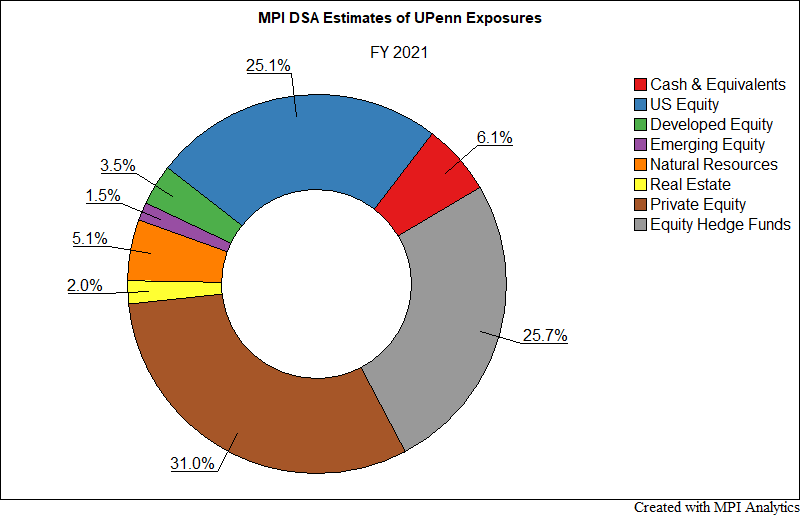
Each color band of the exposure chart represents historical allocation to the respective benchmark, with all exposures adding up to 100%. Such a portfolio could be viewed as a replication of the endowment, albeit in-sample. We observe a notable trend – increasing allocation to private equity and diminishing allocation to fixed-income.
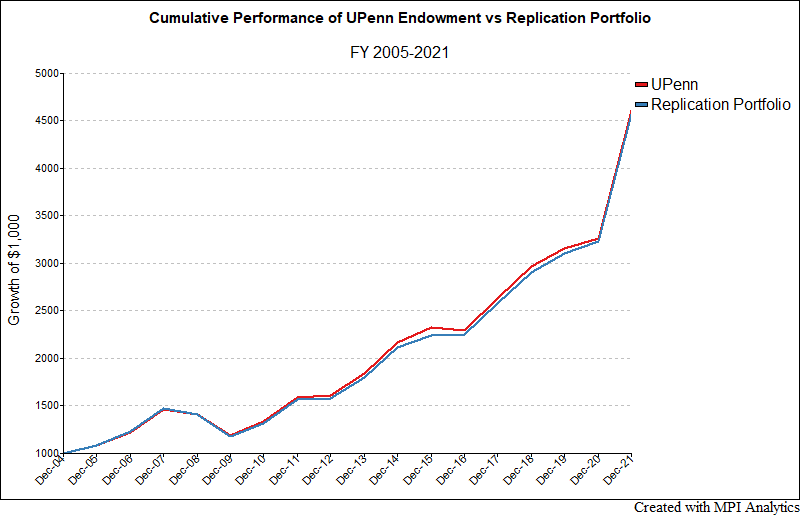
Next, we looked at the total cumulative performance of UPenn’s endowment and our replication portfolio of investment indices, to demonstrate the close correlation between the two return series over the available life of the endowment’s returns. As can be seen below, the style portfolio’s ability to closely track the actual returns demonstrates quantitatively that, as with public pensions (Brinson, et al), asset allocation explains a dominant portion of endowment return movements, both in magnitude and variability. This is critical in giving analysts confidence to fully examine the quantitative results for return and risk information.
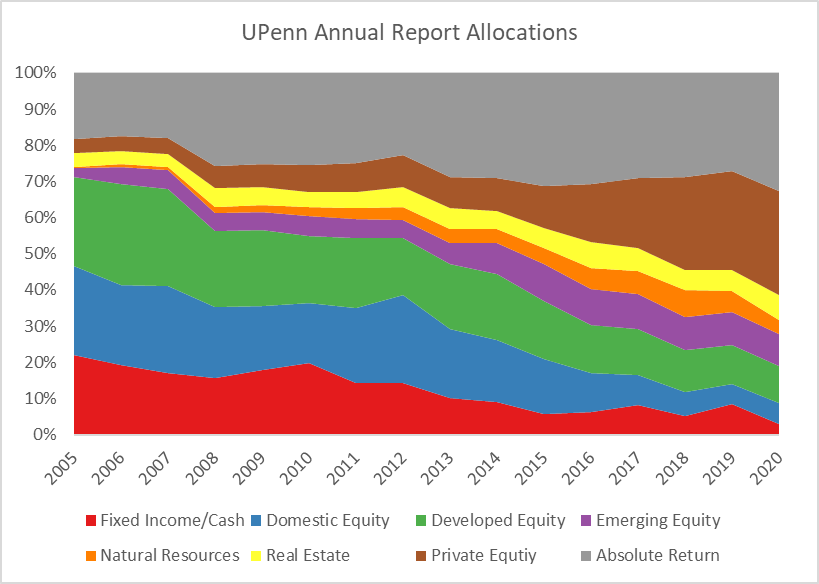
Likewise, our allocation estimates compared well with UPenn’s reported asset allocations. As seen below, our model picked up their ongoing trend away from fixed income and cash very accurately as well as the gradual increase in private equity allocation. When comparing DSA-derived exposures from annual returns to reported allocations, one has to keep in mind that there’s a great deal of overlap between (for example) equity-focused hedge funds and equity (both US and international), and fixed income: a net-long alternative strategy could behave as an equity/fixed blend.
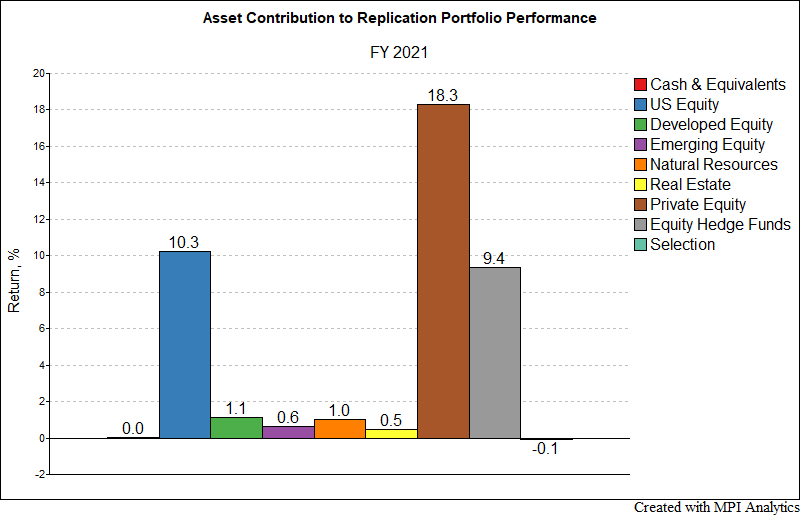
With a high degree of confidence in our tracking portfolio, we started to analyze the contribution from its holdings; specifically, the 60% in combined illiquid (private and real assets) and less liquid (hedge fund) strategies (UPenn’s own FY2020 annual report put these as just over 70% last year).
Private assets appeared to be the largest driver of 2021 performance overall, with 31% of the tracking style portfolio generating 44% of returns[1]. Most of the other strategies present in the portfolio generated returns commensurate with their weights, while natural resources, hedge funds, and fixed income (in particular) fell short.
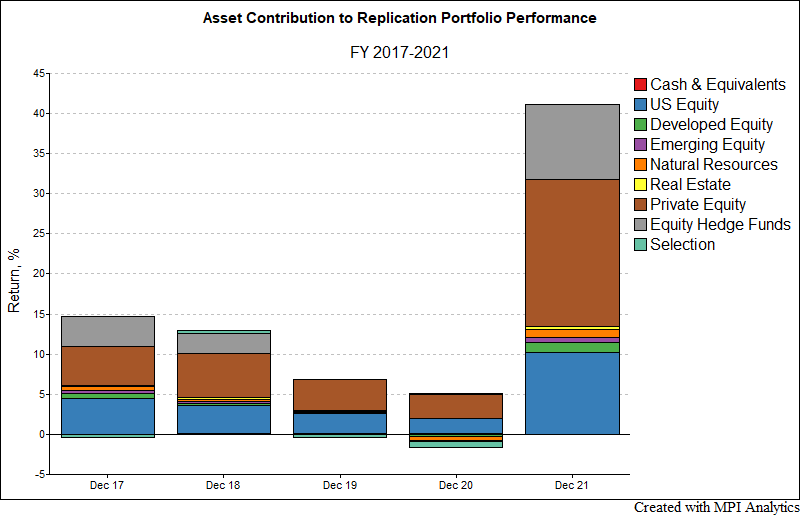
We are seeing the continuation of a multi-year trend in which private assets (and their strong performance) appear to act as the primary driver for UPenn’s performance. At $20.5B, UPenn is well-diversified both in public and private assets, leaving very little “credit” to individual manager selection (“Selection” item in charts above) – despite the extremely wide distribution of PE results year-by-year. This could be an important piece of news for the UPenn endowment team as they chart their future allocations. As new data will come in it would be interesting to see whether we will have an outlier like Brown last year or this will be the Year of Diversification with asset allocation determining all Ivies “to a T.”
As we examine each endowment’s results, we’ll be watching for the effect private equity and venture capital have had across the space, and to see how endowments deal in future with the increase in real portfolio risk that comes from growth of both illiquid assets and equity sleeves – natural results of the exceptionally strong performance of these asset classes in FY21.
[1] The values shown on the contribution chart indicate contributions to the total replication portfolio return of 41%. Private assets contribute 18% out of 41%, or a 44% share of the total return.
—
Factors used in DSA Analysis:
- Cash & Equivalents – ICE BofA US 3-Month Treasury Bill Index
- US Equity – S&P 500 TR Index
- Developed Equity – MSCI EAFE USD Index
- Emerging Equity – MSCI Emerging Markets USD Index
- Natural Resources – Preqin Natural Resources Index (estimate 2021)
- Real Estate – Cambridge Associates Real Estate Index
- Private Equity – Cambridge Associates Private Equity Index
- Equity Hedge Funds – HFRI Equity Hedge Index
DISCLAIMER: MPI conducts performance-based analyses and, beyond any public information, does not claim to know or insinuate what the actual strategy, positions or holdings of the funds discussed are, nor are we commenting on the quality or merits of the strategies. This analysis is purely returns-based and does not reflect actual holdings. Deviations between our analysis and the actual holdings and/or management decisions made by funds are expected and inherent in any quantitative analysis. MPI makes no warranties or guarantees as to the accuracy of this statistical analysis, nor does it take any responsibility for investment decisions made by any parties based on this analysis.