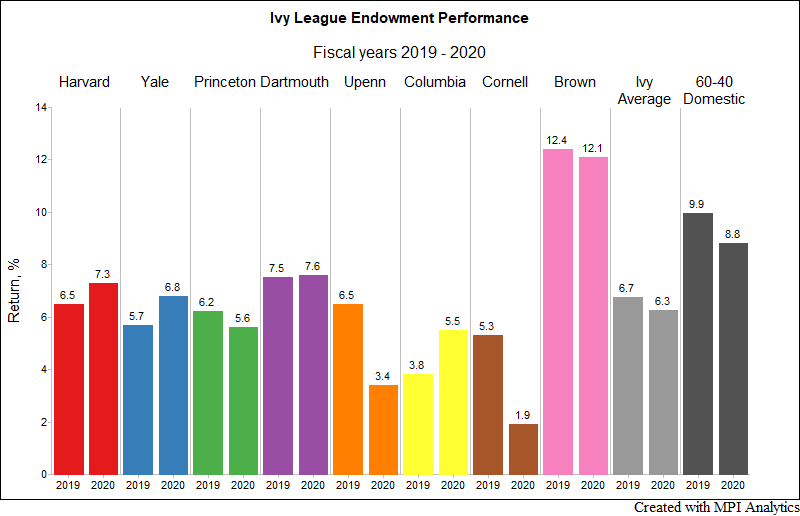
For the second straight year, the Bears outperformed all other Ivy endowment teams by a large margin, producing 12.1% return in 2020 Fiscal Year (FY20) ending June 30th, – bringing the endowment’s value to $4.7B, an all-time high. Dartmouth was a distant second with 7.6%. What’s truly remarkable is that out of the 8 Ivy League Schools, Brown was the only one to outperform a domestic 60-40 equity-bond index portfolio for two years straight.1
Brown’s outstanding performance for FY 2019-2020 also brought them to the top of the pack on a 10-year return basis. With a 10.2% annual trailing 10-year return, Brown now joins Yale (10.9%), Princeton (10.6%), and Dartmouth (10.2%) – to outperform the domestic 60-40 (10.1% 10Y return).
Consultants and industry experts are crediting Brown’s performance to its significant allocation to private investments, however, that doesn’t fully explain why Brown was heads and shoulders above the rest of the Ivies with similar allocations to private assets. For example, according to their FY20 financial statements, Brown’s combined allocation to private equity and venture capital was 31.2%, while Yale – the “alma mater” of the “endowment model” – had 41% target allocation to private investments while producing returns for the past two years that were less than half of Brown’s.2 Essentially, asset allocations in both endowments were quite similar, with a strong emphasis on equity (as shown in the table below), yet they produced quite different results.
Asset Class | Brown (%) | Yale (target, %) |
---|---|---|
Cash and Fixed Income | 9.0 | 7.5 |
Equities | 20.0 | 14.0 |
Real assets | 4.7 | 14.0 |
Venture Capital | 17.8 | 23.5 |
Private Equity | 13.4 | 17.5 |
Absolute return | 35.0 | 23.5 |
A recent WSJ article credits the management team, led by CIO Jane Dietze (a role previously held by Joseph Dowling), for making the bold decision to hire talented hedge fund managers, and provides several anecdotal examples of hedge funds with consistent annual returns of 30%-50%. In the press release, Ms. Dietze attributes the portfolio’s performance results to an “outstanding group of external investment managers who collectively have exercised measured judgment in the face of historic volatility in the financial markets.”
While such an explanation is flattering for both the investment team and fund managers, it doesn’t equate to much for performance and risk professionals who are used to hard numbers of performance attribution, factor beta, marginal and component risk, etc. The question to now ask is: Is there a way to objectively measure such a “collective measured judgement” of a diverse group of talented hedge fund managers given that annual returns is the only public endowment data available?
For the past 5 years, MPI’s research team has embarked on a challenging task to find clues to endowment performance hidden in their annual returns. To do so, we used a returns-based technique developed by Nobel Prize winner Prof. William F. Sharpe in the early 90’s. Over time, we extended this technique to complex arbitrage strategies such as hedge funds, total return and unconstrained fixed income, and it is now used by both investors and even regulators, to understand opaque and secretive investment products. A major advantage of this patented technique – Dynamic Style Analysis or DSA – is that it works incredibly well with short time series, such as sparse annual data.
In our FY19 endowment report, we used a set of generic private and public benchmark indices to decipher a wide dispersion of results between the Ivies. We consistently found that large endowments, like most large diversified investment pools (such as pension funds), are a perfect illustration of the power of diversification, with asset allocation explaining the dominant share of their results. However, some portion of their return (“model error” which we call “manager selection” or simply “selection”) remains unexplained. Based on our analysis, last fiscal year Brown’s selection return – the portion unexplained by the broad generic asset class benchmarks – was significant and notable as the only positive value among Ivies. We applied the same set of asset class benchmarks for FY20, and we again saw a significant selection return. Typically, our analysts don’t like to see a large portion of return unexplained by the model. It could mean many interesting things for an obscure hedge fund, but for a diversified $5B investment pool it’s an indication of the model missing an important factor(s).
In our search for missing factors, we first turned to annual endowment reports and audited financial statements. We summarize Brown’s 10 years of asset allocation in the chart below.
Clearly, absolute return strategies dominate the endowment’s portfolio. In addition, a significant portion of the absolute return segment is allocated to equity long-short hedge funds. According to the 2019 annual report “…the largest portion execute strategies with varying degrees of market exposure focused primarily on equities” and “roughly one-third of the absolute return portfolio” is allocated specifically to equity market neutral strategies.
We find additional clues in the previously mentioned WSJ article, which mentions Atreides Management LP, Melvin Capital Management, and Skye Global Management as examples of spectacular investments by the Brown team. When looking at the fund descriptions and 13F filings for the investment companies, a common theme emerges – Technology. For example, Atreides’ website states “Atreides Management, LP brings the long-term perspective of a private equity investor to high growth technology and consumer companies and invests across public and private markets.” Skye is a long-short hedge fund with top five long positions as of 2QTR 2020 include MSFT, FB, AMZN, GOOG. Melvin Capital “invests primarily in tech and consumer stocks” according to the Wikipedia article.
The technology sector has had a phenomenal run for the past two years. In FY20 specifically, the S&P 500 Information Technology Index return was up 35.9% – much higher than Cambridge Associates’ Private Equity (9%) and Venture Capital (11.8%).3 It is quite plausible to assume that technology is the missing factor that could explain the performance of Brown’s stable of long-short hedge fund managers when all “longs” cancel out with all “shorts.”
Using MPI Stylus Pro’s Dynamic Style Analysis, we aim to create a portfolio of generic asset class benchmarks (plus Technology sector index) that predictively mimics the annual return of the Brown endowment portfolio. Our model is versatile and allows us to incorporate an additional bit of valuable information gleaned from the WSJ article – specifically that Brown doesn’t rebalance their portfolio as frequently as other endowments. This allows for their best-performing segments to grow and less performing to dwindle over time – a momentum approach vs. a more disciplined approach of a pension fund that has stricter investment guidelines and horizons.
Below, we show the results of the analysis. Each color band represents historical estimated weights in the mimicking portfolio of asset class indices. Comparing our quantitative analysis of annual returns and published allocation numbers taken from financial statements, it is easy to spot the similarity of the trends captured by rapidly increasing VC allocation and dwindling exposure to Real Assets. At the same time, our analysis overestimated private equity allocation while underestimating public equities with the combined allocation is about the same.
It is easy to see that the combined exposure to Hedge Funds and Technology is very similar to the Absolute Return allocation in financial statements. According to our analysis, estimated exposure4 to technology almost doubled over the past three years, which could be, in part, driven by specific investments mentioned in the WSJ, which grew organically while dominating other segment returns.
The chart below shows the total cumulative performance of the Brown endowment and the mimicking “tracker” portfolio of asset class benchmarks determined by DSA. A relatively stable portfolio of asset indices replicates endowment returns very closely (albeit in-sample) leaving very little unexplained – a significant improvement over the generic model that we used in previous years.
Analyzing each asset class’s contribution to the total return of the tracker portfolio could help understand why Brown outperformed. The Performance Attribution chart below shows estimated total return contributions given asset class exposures determined by DSA. Over the past two years, Private Equity, Venture Capital, and Technology dominated the endowment’s return with selection being negligible. And while 2019 was “the year of Private Assets” for Brown, this FY20 was clearly “the year of Tech.” Whether known or unbeknownst to the investment team, they seem to have accumulated a significant overexposure to tech stocks which, regardless of the skills of their managers, could be valuable information for their risk team.
We conclude with the following important takeaways:
- It is quite possible that Brown’s investment team’s quest for the best talent created a significant over-exposure to the Technology sector which has worked to their advantage, so far;
- Never underestimate the power of diversification, especially with hedge funds. A portfolio of hedge funds typically diversifies at a faster rate than a portfolio of stocks and traditional investments, due to the cancellation of opposite bets/themes between funds resulting in an index-like behavior and returns;
- Significant “alpha” can often signal the deficiency of the model or a missing factor – rather than a proverbial “skill.”
- If such precision in identifying portfolio exposures could be attained using annual data, one might achieve greater results using quarterly data for private asset portfolio and monthly/daily data for public market assets portfolio.
Footnotes
- 1 The FY19 9.9% and FY20 8.8% return of a domestic 60-40 portfolio using the S&P 500 Index and Bloomberg Barclays U.S. Aggregate Bond Index, rebalanced quarterly, which we calculated. Some of our previous reports used daily rebalanced 60-40 and the difference in performance is negligible. As we’ve discussed before, the composition of the average endowment, and even pension, is often significantly varied from U.S. public equities and fixed income but it provides some measure of what a simple, liquid, low cost and diversified model could attain relative to the complexities, illiquidity and higher cost of the Ivy or Yale endowment model.
- 22-year FY2019-2020 compounded return: Yale 12.9%, Brown 26.0%
- 3Asset Class Benchmarks
Asset Class Index US Bonds Bloomberg Barclays U.S. Aggregate Bond US Equity S&P 500 Index Foreign Equity MSCI EAFE Index Emerging Market Equity MSCI Emerging Markets Index Real Estate Cambridge Associates Real Estate Private Equity Cambridge Associates Private Equity Venture Capital Cambridge Associates Venture Capital Natural Resources Preqin Natural Resources Index Hedge Funds HFR Fund Weighted Composite Index Technology S&P500 Information Technology Index - 4We should have said “overexposure” because other indices such as S&P 500 Index (used as a proxy for US Equities) have proportional technology allocations.