Common and Active Style® Analysis
Beyond Correlation: MPI’s measures for analyzing investment similarity
When making investment selection and allocation decisions, it is important to understand how funds and investment products relate to each other, how similar or dissimilar they are. This requires going beyond simple linear measures such as correlation. Common and Active Style® Analysis – MPI’s patent-pending measures – do just that, providing a quick and powerful way to analyze similarities and differences in investment style and factor exposures across a portfolio, between managers, and/or against a benchmark. Those that work with portfolios, retirement plans and fund lineups can also assess levels of style diversification from product to product to aid in investment decision making and portfolio construction.
What are Common and Active Style?
- Patent-pending tools to assess the diversification within a portfolio, plan lineup, or between managers, as well as the level of active management from a benchmark.
- An analysis that reflects the percentage of concentration between the factor exposures of the products within a portfolio or fund lineup (401(k), DC or DB plan, etc.).
How are these measures unique?
- Based on MPI’s precise returns-based models, Common and Active Style examine the commonalities in investment style, or factor exposures, shared by any group of managers or investments as specified by the user.
- Existing approaches are holdings-based, looking at the actual stocks and securities that the funds or portfolios have in common, though typically in a non-weighted approach. MPI’s measures, however, do not require holdings nor rely on rigid categorizations of those holdings, giving investors a better understanding of exposures that may be driving returns.
- Common and Active Style® are timely, relying only on returns streams. Most holdings-based measures rely on data that is reported with a lag, incomplete, and too infrequent to be meaningful.
- Traditional correlation statistics measure only the similarity of mutual co-movement of financial instruments. MPI Common and Active Style capture the degree of mutual concentration, a more accurate and telling measure of similarity based on fundamental properties.
Common Style
Common style is an improved measure of investment similarity that provides more insight than simple linear statistical correlation.
How does this help me do my job better?
- For portfolios or lineups, Common Style helps to quickly analyze plan diversification and aid in portfolio construction, as well as ongoing monitoring of plans or fund lineups. Using MPI’s similarity measures based on fundamental or economic exposures, one can better understand what behavior and risk to expect from a portfolio in different market scenarios.
- Plan Sponsors and other institutionally-oriented investors want to see that their chosen lineup of managers and investments is not veering into concentrations that may pose unintended risks, and/or diverge from intentions, i.e. to ensure they are not paying for exposure duplication or unintended netting.
- For manager research and selection, Common Style helps assess concentration between funds to find the optimal investment based on factor exposures.
What does a higher level of Common Style indicate?
A high rate of commonality indicates less diversification across factor exposures in the group of funds that one is assessing (in a portfolio and/or fund lineup).
This matrix – showing the level of commonality between funds – provides a powerful picture of the overall differences between portfolio components. Let’s start by looking at the lower right of the matrix; the target-date funds display the expected relationships with each other – the concentration decreases as the time interval increases. Moving to the left, we see the later maturity target-date funds (higher equity) intersect less with bond funds. When comparing the target date funds to equity funds, the model picks up the inverse relationship. Again, these results align with the more aggressive equity exposure across target-date fund maturities, but it’s important to note that no qualitative or fundamental information was introduced into the model; these relationships were detected solely from the similarity in exposures determined by returns-based analysis.
How does this compare with a simple correlation matrix analysis, a linear measure that is often used in portfolio analysis?
As seen when comparing these two matrices, investors miss significant quantitative insight when only using a correlation matrix. Treating each fund as though it was a unique security – not the combination of many individual instruments that it truly is – most equity funds have extremely high correlations. This oversimplification is a classic problem, which can be overcome when using MPI’s patent-pending Common Style, giving investors powerful insight into their managers and portfolios.
Active Style
Active Style is MPI’s factor-based measurement of how different a fund is from its benchmark or other funds. Active Style provides a more accurate view than the relatively new holdings-based statistic, Active Share, through more timely data and precise returns-based analysis.
How does this help me do my job better?
- For manager selection, Active Style® provides more accurate insight into a manager’s investment style, whether it is more active or passive. This distinction helps aid investment decision making and portfolio construction to achieve the style and level of management desired.
- In times when markets are highly correlated, fund managers can use Active Style® analysis to better differentiate their funds from their peers, particularly when correlations can deceptively make unlike products appear like.
Read more on Active Style and its applications: Active Style vs Correlation
How does MPI compute Active and Common Style?
- Step 1: We start with a precise returns-based analysis of historical exposures of two funds or a fund and a benchmark (as in the example above).
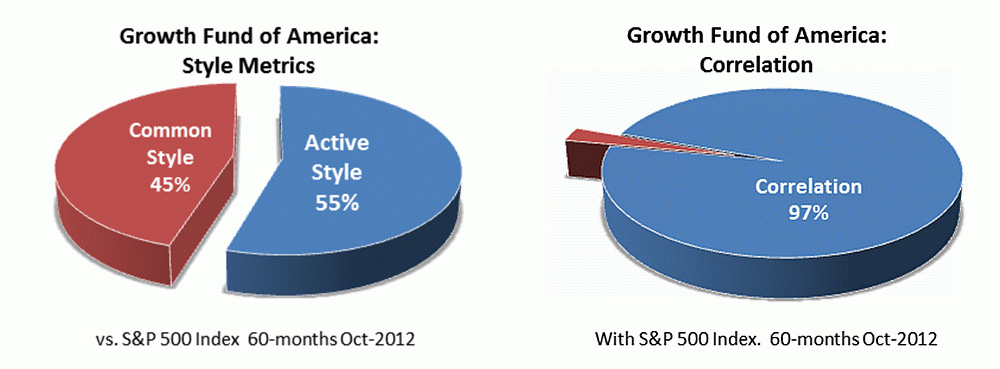
- Step 2: We then subtract benchmark exposures from that of the fund. Positive and negative differentials – the overweighting or underweighting of certain factors, respectively – indicate active style “bets”. Common exposures indicate mutual factor exposures. The above visualizes excess exposures of the Fund to the Benchmark over time.
- Step 3: The sum of all active exposures we call Active Style®. The sum of all common exposures we call Common Style. As seen in the above, Common and Active Style add up to 100%.
- Step 4: Such Style Metrics can be computed on a rolling basis, as in the chart above, or averaged over time.