Since its launch in 2007, PIMCO Income Fund has become one of the top-performing US bond funds overall and the only one consistently in the top quartile of its category over the previous nine years. However, in 2019 the fund underperformed both the benchmark and most of its peers. Using this fund as an example, we will demonstrate how advanced returns-based analysis can be used to analyze complex fixed income products without delving into volumes of complex holdings.
PIMCO Income Fund (ticker: PIMIX for institutional share class) is the largest actively managed bond mutual fund, with assets of more than $130 billion and over $200B globally in the strategy. Since its inception the fund has outperformed all but three U.S. bond funds delivering an average annualized return of 8.2% for the period from April 2007 to November 2019. In Figure 1, below, we show the fund’s performance and AUM vs all U.S. bond funds in the Morningstar database. Only Vanguard Total Bond Market Index Fund (VBMFX) – a passively managed index fund – has more assets than PIMCO Income and only three funds, two of which are managed by PIMCO, have had better performance.
Figure 1: Performance Since Inception and AUM vs. Entire U.S. Bond Fund Universe
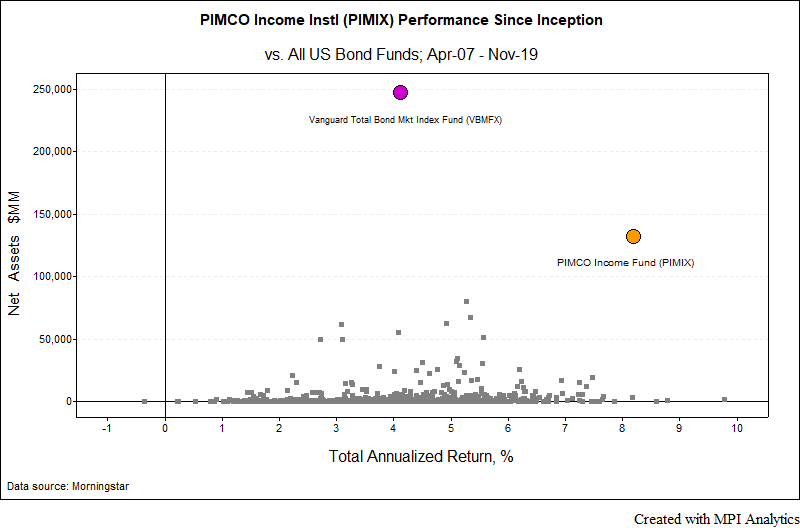
Morningstar categorizes PIMCO Income as a multisector bond fund. According to the fund researcher, funds in this category:
“seek income by diversifying their assets among several fixed-income sectors, usually U.S. government obligations, U.S. corporate bonds, foreign bonds, and high-yield U.S. debt securities. These portfolios typically hold 35% to 65% of bond assets in securities that are not rated or are rated by a major agency such as Standard & Poor’s or Moody’s at the level of BB (considered speculative for taxable bonds) and below.”
There are 108 funds1 in the Morningstar multisector bond category with at least 3 years of performance history. Compared to this peer group, PIMCO Income fund has had an amazing run over the past nine years. The chart in Figure 2 below depicts the fund’s annual performance ranks since inception2 (yellow) versus the peer group (gray-scale bands for peer group quartiles) and benchmark (blue). As we see in Figure 2, PIMIX consistently ranked in the top quartile in nine out of the past ten years, from 2010-2018. In 2019, however, its relative performance reversed; through November PIMIX has lagged almost 90% of its peers.
Figure 2: Annual Performance Ranks vs. Peer Group
A Positions Puzzle
What lies behind PIMCO Income’s successful run over the past decade and what happened in 2019? It is widely known that the fund invests heavily in non-agency mortgages and employs derivatives. Both PIMCO’s and Morningstar’s pages for PIMIX, as well as SEC Edgar filings, provide a great deal of detail on the fund’s holdings, portfolio allocations and characteristics, such as duration, credit ratings, etc. However, can anyone distill all of those changing positions and derivatives into an easily understood narrative of its net behavior and market drivers over time? What portion of the fund’s performance could be attributed to mortgage or emerging market bets? How have its risk exposures differed from those of its benchmark and peers?
We will start with a summary of the fund’s latest holdings from Morningstar:
Portfolio Date | 30-Sep-19 |
Equity Holdings | 24 |
Bond Holdings | 7,073 |
Other Holdings | 473 |
% Assets in Top 10 Holdings | -32 |
Reported Turnover % | 472 |
Pretty much all of the top holdings are either futures or swaps. Fund data and research providers, like Morningstar, as well as most institutional investors, are not capable of netting those swap positions against thousands of bonds, some of which are not easily priced. It is worth noting that the sum of top 10 derivatives positions is negative 32% and, on top of that, the fund turns over its entire portfolio every other month (472% turnover), rendering intermittently disclosed holdings snapshots useless.
Over the past 30 years, investors have been relying on returns-based factor or style analysis to make sense of performance data, to reconcile it with the information provided by fund companies, to detect hidden or unwanted exposures and to identify manager skill. As a matter of fact, it’s the only practical and effective way to perform such validation without significant investment into risk and portfolio technology infrastructure. Returns-based techniques have increasingly been adopted by internal compliance professionals, fund company boards and even regulators to alert to possible red flags, potential aberrations and unintended “course corrections.” The main reason for such wide acceptance is that these techniques are objective, non-intrusive, scalable, asset-class agnostic and relatively inexpensive. Returns-based analysis can also cover an entire portfolio of different investment products – even those that do not provide position-level transparency. When applied properly and with precision, the returns-based approach is effective in uncovering the drivers behind a fund’s performance, both long- and short-term.
Although returns-based tools have been a mainstay in equity fund analysis for over twenty-five years, their use and acceptance in fixed income product due diligence has been less widespread – despite arguably being of greatest benefit to investors.
Returns-based analysis starts with a careful selection of factors. In the case of PIMIX, we start with broad ICE BofAML indices representing major fixed income market sectors. We add the JPMorgan Emerging Market Bond index and Markit iBoxx Non-agency RMBS index as additional factors, given the fund’s well-documented exposure to these asset classes. To mitigate the multicollinearity challenges in multi-factor dynamic regressions of fixed income, we convert bond indices into credit risk factors by removing interest rate risk.3 Finally, MPI’s proprietary dynamic style analysis engine (“DSA”) is used to (a) alleviate any multicollinearity issues arising from rolling-window RBSA and (b) capture the dynamics of a rapidly changing portfolio (note high turnover) in a timely and precise way.
Risk Factor Exposures
The results of our analysis, presented in Figure 3, depict the fund’s major risk exposures in the past 7 years4 compared to that of the Bloomberg Barclays U.S. Aggregate Bond index – the benchmark listed in the fund’s prospectus.5 Different colors represent the varying exposures to fixed income factors – often referred to as risk factor betas – over time. The fit of the analysis is very high with R-squared at 92% and MPI’s Predicted R-squared at 86%.6By comparison, the fund’s benchmark R-squared is only 10%, indicating that the fund is not investing like a traditional core bond fund. 7
Figure 3: Long-term Dynamic Risk Factor Exposures vs. Benchmark
We observe that factor betas are quite different from the prospectus benchmark:
- Interest rate risk is the dominant factor for the benchmark while being less than a third of the factor exposure for the fund8
- Exposure to agency MBS is more than twice that of the benchmark
- No significant exposure to corporate credit or high yield
- Noticeable exposure to non-agency Mortgages and Emerging Market debt
- Significant exposure to Asset Backed (ABS) securities9
Factor Dynamics:
- Non-agency MBS exposure has diminished since 2012 but it’s still significant in absolute terms given the size of the fund10
- MBS exposure significantly increased and exposure to interest rates decreased over time – which is in line with a recent interview with Ivascyn the fund manager
- Exposure to corporate credit (corporates plus high yield) has decreased since 2015-16
- Despite increased exposure to risk factors, the interest rate exposure remains low, which means that the manager is likely actively hedging interest rate risk
- Exposures are relatively stable, which speaks to the quality of the analysis. This means that the high turnover figure reported by the fund could be related to either trading within sectors and/or use and nature of derivatives.
The chart in Figure 4 shows the cumulative performance of the fund (“Total”, in yellow) compared to the returns of the synthetic factor portfolio (“Style”, in green) and the Benchmark (in blue). The synthetic “Style” portfolio (green) is essentially a tracking portfolio created from the exposure weights shown in Figure 3.11 The tight tracking between these two return series indicates that the fund’s performance has been well captured by the dynamic factor exposures depicted in Figure 3.
Figure 4: Cumulative Performance of the Fund vs. its Factor/Style Portfolio
Performance Attribution Analysis
Now that we have a quality factor model of the fund, the first application for investors is to quantify the drivers of the fund’s performance – i.e., attribution analysis.12 The performance attribution chart below in Figure 5 breaks down the fund’s performance into fixed income factor buckets according to the dynamic historical exposures in Figure 3.13 The dominating component of the trailing 7 year performance was non-agency MBS – higher risk mortgages that are not guaranteed by FNMA and GNMA. One can see that the main sources of PIMCO Income fund’s performance lie outside the Bloomberg Barclay’s U.S. Aggregate Bond Index’ universe: Emerging Market debt, High Yield, Asset Backed – in addition to the non-agency MBS that were mentioned earlier.
Figure 5: Total Returns-Based Performance Attribution: 2012-2019
Given the significant and obvious differences between the fund and the benchmark, it is perhaps more insightful to compare PIMIX to the funds in the multisector bond category. We focus on the non-agency MBS factor as it is the dominant source of performance according to our model. Figure 6 compares the non-agency MBS exposure of the fund to that of its peers (gray-scale for quartiles). Interestingly, while the fund’s non-agency MBS factor beta has decreased by more than 50% over time (from being almost double that of any other fund in the category) it still measures near the top of the category. But how much did the fund’s exposure decrease versus how much did PIMIX grow while the non-agency MBS sector shrunk?14 The fund’s AUM grew more than ten-fold to $200B in worldwide assets over the same period and, as our analysis shows, roughly half of the fund’s total performance came from its exposure to this segment.
Figure 6: Historical Non-agency MBS Exposures vs. Multisector Bond Category
The fund’s underperformance versus its peer group and benchmark in 2019 is also well-reported. As shown in the chart below, the fund returned 6.63% through November, underperforming the benchmark by over 2% and ranking below 88% of its peers.
Figure 7: PIMCO Income Fund 2019 YTD Performance
A returns-based framework provides an elegant way to quantify the source of the funds’ relative performance to the benchmark by breaking down the systematic portion of such excess benchmark return into components attributed to factor over/under-weighting vs. the benchmark. All that is needed for such an analysis is shown in Figure 3 – that and also each factor’s performance YTD. As shown in Figure 8, which breaks down the 2.3% underperformance of the fund vs. the 8.8% return of the Bloomberg Barclays U.S. Aggregate Bond Index through November, significant overexposure to the two worst-performing YTD segments – agency MBS (6.2%) and Asset Backed (4.3%) – as well as underexposure to Interest Rates and Corporates were the major contributors to the fund’s poor relative performance this year. And while non-agency MBS were one of the best performing segments this year (17% YTD) contributing positively to the fund’s performance, its dominance is not as pronounced as in previous years.15 In addition, as we’ve discussed above and in the footnotes, the fund’s exposure to this major contributor to Pimco Income’s mid- and long-term outperformance has shrunk, apparently a function of the growth of the fund’s AUM and the relatively small and decreasing size of the non-agency RMBS market.
Figure 8: Factor Attribution (excess benchmark)
Final Thought: Traditional RBSA and complex fixed income
We mentioned earlier that the analyses above employ MPI’s DSA – Dynamic Style Analysis – a true dynamic model designed to fight collinearity that can be especially pronounced with fixed income factors. In a comprehensive analysis with a large number of factors, generally required for unconstrained “go-anywhere” products like the PIMCO Income Fund, traditional rolling-window RBSA fails to provide meaningful results. The chart in Figure 9 shows the results from using the 24-month rolling RBSA with the same factors and data used in our analysis above (see Figure 3). Looking at the results of this traditional 24-month rolling window analysis, it would be difficult for most practitioners to accept the results – exposures that fluctuate wildly month-to-month in a $200B portfolio.
Figure 9: 24-Month Rolling RBSA
The reason for such behavior is that traditional RBSA is very sensitive to multicollinearity, especially when performed with “rolling windows”. Moreover, paradoxically, in order to capture the dynamics of the fund’s exposures, such rolling window regressions rely on a gimmick – the assumption that exposures are constant within each window. Employing window-based regressions also limits the number of factors that could be used. By contrast, DSA represents a true dynamic model in that it assumes varying betas throughout the fund’s history. At the same time, to prevent overfitting, it provides control for the turnover of such a beta-mimicking portfolio. As a result, we’re getting both a closer fit and a more realistic behavior of betas.
Really Final Thought
Though not short, this was a quick analysis, something that many of our users – fund analysts, product teams and investors alike – perform on daily basis. By no means had we intended this to be a comprehensive tutorial and/or a formal methodology paper. We left out a lot of detail and focused on the main theme: fixed income products are not that hard to crack… once you’ve figured out the factors and use the right tools.
Footnotes
- 1Peer group contains both active and non-active (liquidated) funds, one share class per product. 79 of these funds are currently active.
- 2Fund inception date is March 2007; we’re showing performance from first full year – 2008
- 3For this quick analysis we simply created spread factors by subtracting Treasury index – the proxy for interest rates. We will be refining this preliminary analysis in coming weeks by adding additional factors and using higher frequency data to glean more detail on the fund’s exposures. Please contact MPI for more detailed info.
- 4The Markit index’ inception is 2012, which effectively puts a limit on our analysis; otherwise, it would start earlier than 2012.
- 5There is much debate on properly benchmarking complex fixed income strategies. Whether such a relatively static measure of the traditional fixed income universe such as Bloomberg Barclays U.S. Aggregate Bond Index, the default benchmark for the more common core bond funds within the intermediate-term bond category, is appropriate in this instance is not something we aim to tackle or solve here.
- 6MPI’s proprietary cross-validation credibility metric is similar to those commonly used in machine learning applications. Such a high number means that the fund’s performance could be projected even out-of-sample.
- 7DISCLAIMER: MPI conducts performance-based analyses and, beyond any public information, does not claim to know or insinuate what the actual strategy, positions or holdings of the funds or portfolios discussed are, nor are we commenting on the quality or merits of the strategies. This analysis is purely returns-based and does not reflect insights into actual holdings. Deviations between our analysis and the actual holdings and/or management decisions made by funds are expected and inherent in any quantitative analysis. MPI makes no warranties or guarantees as to the accuracy of this statistical analysis, nor does it take any responsibility for investment decisions made by any parties based on this analysis.
- 8According to this research from Blackrock, the Bloomberg Barclays U.S. Aggregate Bond Index currently derives approximately 80% of its returns from interest-rate risk. From our analysis the overall current factor exposure weight for the fund is above 2.4 while interest rate is less than 0.8.
- 9 Exposure to ABS is noticeably higher than reported by the fund company. We should mention that correlations between ABS, agency MBS and non-agency MBS remains high even after removing the interest rate component, which might have affected the analysis. In addition, according to the fund’s factsheet, the portfolio holds 16% in credit default swaps (CDS) which too might have an effect. The fund also has significant short positions in developed countries’ debt. We should reiterate that this analysis may not be reflective of the fund’s holdings. At the same time, we intend to refine our model in the future posts using higher frequency data.
- 10By some estimates, the size of the non-agency RMBS market is $400B with very few new issuances – a substantial decline from approximately $2 trillion pre-Crisis.
- 11We show cumulative performance for illustrative purposes under the assumption that our risk factors are investible. Additionally, we do not account for any fees or expenses to trade and/or short the risk factors.
- 12As we have mentioned above, to properly do a holdings-based attribution analysis one needs to have daily positions of the fund, daily swap and bond prices verified through multiple sources and a multi-million dollar infrastructure that provides accurate net derivative positions. And yet, a system like that is still exposed to various price, holdings and model errors – as well as the aforementioned stale data issue with positions that are no longer in the portfolio. However, returns-based factor analysis can complement this by conducting a cost-effective, independent analysis of the fund and its peer group.
- 13We don’t include cross-product between factors typically provided in attribution as it’s negligible.
- 14See footnote 8 as well as this from Morningstar analyst Eric Jacobson in their PIMIX analysis: That sector (non-agency residential mortgages) has been shrinking at a rate of 10%-15% per year, while the fund itself has mostly grown at a furious clip. Absent a sea change in the market, though, the non-agency mortgage sector will continue to shrink. We would prefer PIMCO consider closing the strategy to new money should the managers have trouble keeping the exposure as large as they’d like, but the firm has no plans to consider that option.
- 15Markit iBoxx non-agency RMBS index return since inception in January 2012 through November 2019 is 18.6% annualized vs. 2.9% for the BBgBarc Aggregate Index over the same period.