Large and Small Endowment Performance and Risk
We sought to examine the relationships between endowment size, pedigree and exposure to private assets and what impact that may have on portfolio risk using advanced quantitative methods and a cutting edge methodology to better model the true behavior and risk profile of private market assets.
At the beginning of July, endowments’ fiscal year turned over. As investment professionals look forward to seeing how their alma maters, and their heroes and heroines of the endowment allocating world, performed, we linked up with Institutional Investor who asked us for some new research for a story looking at endowment investing.
We sought to examine the relationships between endowment size, pedigree and exposure to private asset classes (notably Private Equity and Venture Capital) and what impact that may have on portfolio risk using advanced quantitative methods and a cutting edge methodology to better model the true behavior and risk profile of private market assets. To do so, we looked at endowments in three size tiers, as well as the group of elite Ivy League endowments that have led the way employing the “Yale model” of significantly allocating to private market assets and esoteric strategies in part to harvest the illiquidity premium.
To start, we extracted historical average annual return data for endowments from NACUBO historical tables and FY2018 from public 2018 NACUBO-TIAA Study of Endowments (NTSE) tables. We gained the average of Ivy Endowments’ returns from previous work MPI has done focused on this elite group of endowments, many with ties to the progenitor of the Yale model, David Swensen, compiling that data from annual reports. To isolate the behavior of the leader of this widely mimicked investing style, we include Yale on its own, in addition to being included in the Ivy average.
Below, we show rolling 10-year and 9-year returns of Yale’s endowment, the Ivy average and three size-based sleeves ($101-500M; $501M-$1B; >$1B) from NACUBO’s endowment reports compared to a domestic 60/40 portfolio1 comprised of S&P 500 Index and Bloomberg Barclays U.S. Aggregate Index, respectively.
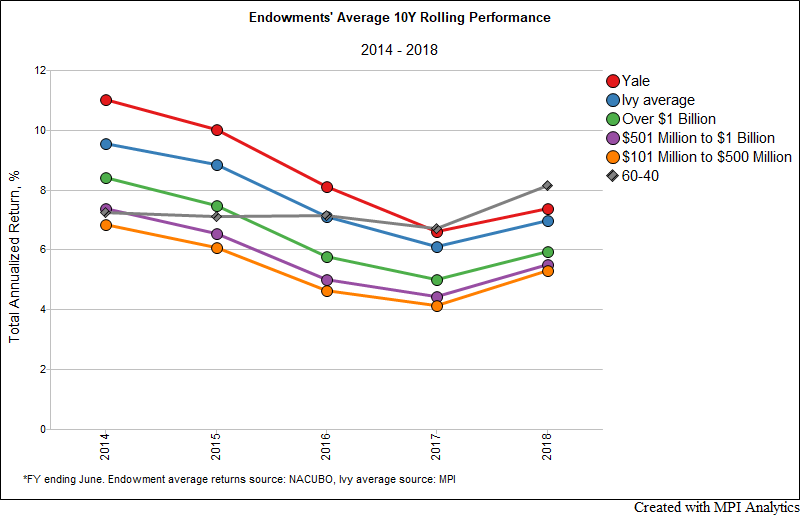
Yale dominates the rest, followed by the “average Ivy”. Interestingly, there is a relationship between performance and size, with larger endowment averages leading mid- and small-endowment systems, respectively, resulting in the lines being mostly parallel. As we noted in our fiscal year 2018 Ivy report, the 60/40 portfolio’s 10Y performance over the past several years overtook all Ivies and all endowment averages.
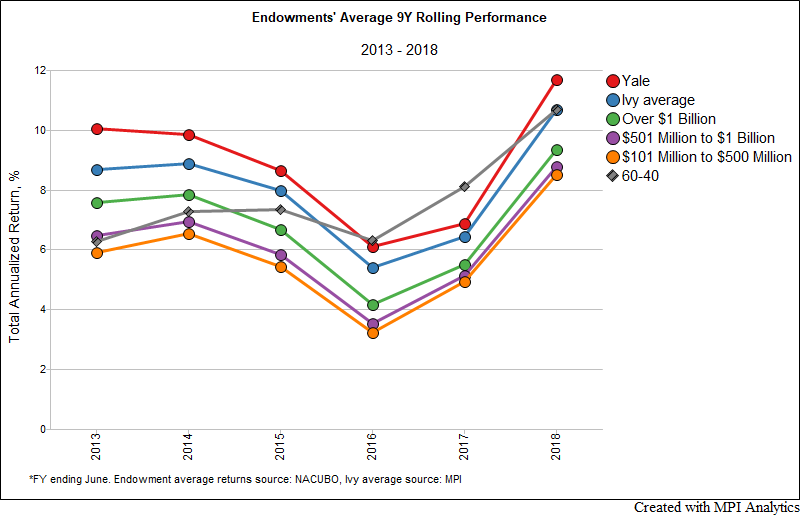
We also show 9-year rolling averages to visualize the effect of the GFC being removed from the look-back performance window. FY2018 trailing 9-year performance jumps but the “parallel” pattern remains the same and the 60/40 still dominates (albeit trailing Yale).
Private Asset Class Exposure Trends
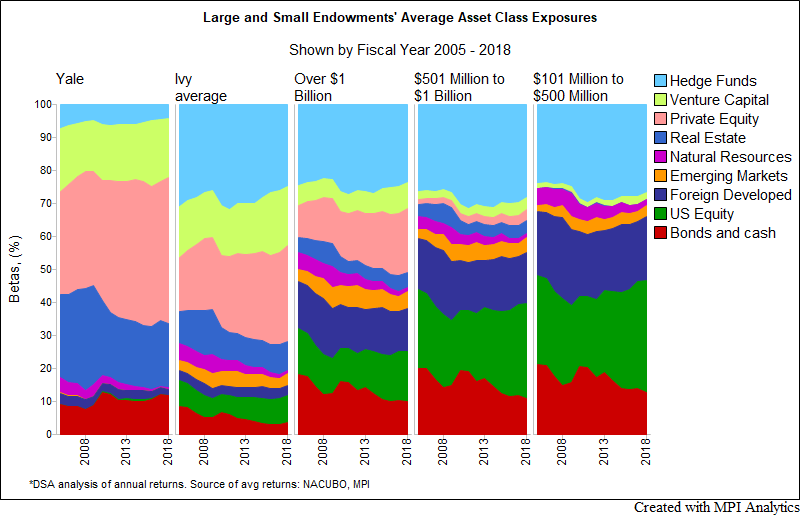
Using MPI’s Stylus Pro system, we utilize our proprietary Dynamic Style Analysis, an enhanced quantitative (returns-based) analysis model, to dynamically capture the exposures of the endowment groups, and, again, Yale on its own2. We use a common factor set across all endowments to estimate the annual exposure averages of the endowments using the same asset class or factor indices that we used in our 2018 report:
Table 1. Factor Proxies by Asset Class
| Asset Class | Factor |
| Bonds and Cash | Bloomberg Barclays U.S. Aggregate Bond |
| US Equity | S&P 500 |
| Foreign Developed Equity | MSCI EAFE |
| Emerging Market Equity | MSCI Emerging Markets |
| Real Estate | Cambridge Associates Real Estate |
| Private Equity | Cambridge Associates Private Equity |
| Venture Capital | Cambridge Associates Venture Capital |
| Natural Resources | Bloomberg Commodity |
| Hedge Funds | Eurekahedge 50 |
The results are shown in the area chart below. No surprises here really – the smaller the endowments, the larger portion is allocated to traditional, public market asset classes (though there does appear to be significant exposure to Hedge Funds amongst all groups studied). And while NACUBO is actually collecting asset allocation information from endowments, what we learned by examining a large number of annual returns is that the definition of asset classes and their proxy benchmarks vary significantly between endowments. Another issue is that the lines are blurry between investment products that endowments are invested in: e.g., some alternative products may behave closer to directional traditional long-only strategies. The goal of our analysis is two-fold: (a) bringing this data to a common denominator by using industry-standard asset class benchmarks and (b) validating the averages by confirming trends from NACUBO historical studies.
We extract PE and VC data into a separate chart below to show the trends in private asset investing among endowments of different sizes. Notably, the “Yale model” that dominated Ivy endowments over the past 10+ years has been adopted with the same rate of growth by large endowments with assets >$1B and the rest of the Ivies.
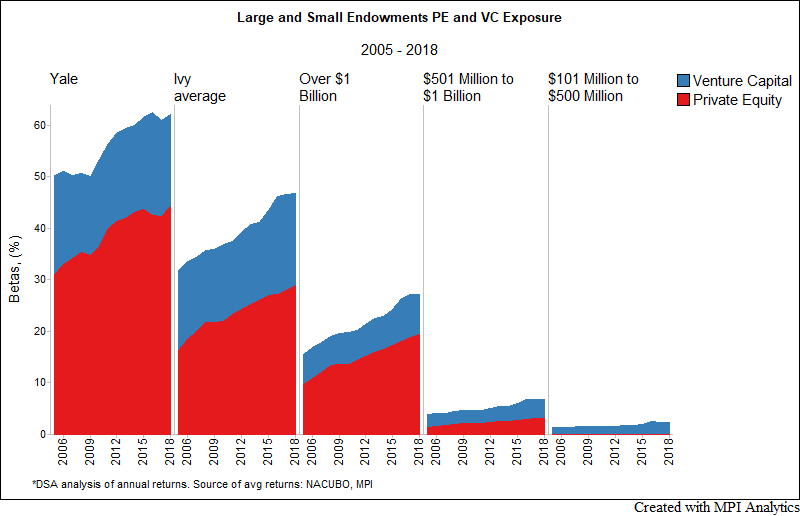
The link between the chart above and the 10-year rolling performance “parallel lines” chart is striking – the higher the adoption rate of the private investments – the better are the endowment results.
Risk
At first glance, it’s easy to accept that the drivers of superior performance are the hallmarks of the “Ivy model”. As described by Yale’s longtime endowment manager David Swensen, this boils down to: focus on alternatives, strong emphasis on asset allocation, including negligible exposure to commodities and commodity-related markets, and positive returns arising from access to superior (active) investment talent. But as we’ve shown in our earlier work, a significant part of the Yale success story is related to the higher risk associated with private investments. Smoothed and infrequently valued private market asset returns create an illusion of them being less risky while in fact they could carry significant risks, even higher than public equities.
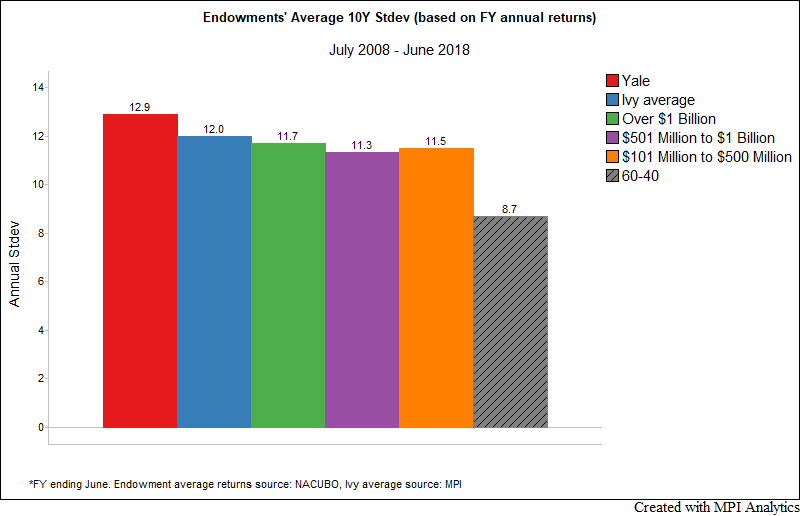
In order to illustrate this concept we compute the annual standard deviation for Yale, Ivy average and the three NACUBO study endowment size averages using 10 years of annual reported returns (only ten observations in total). As the Global Financial Crisis (GFC) is included in the 10Y window that starts in July 2008 (endowments report on a fiscal year basis from July 1-June 30th), Yale appears the most risky followed by the Ivy average. In FY 2009, Yale suffered significant losses of -24.6%, and, as we estimated in previous research, the actual intra-year drawdown was likely much greater at -35.8%, compared to -26.3% for a domestic 60-40 portfolio.
Thanks to the fact that GFC was included in the window, we could at least get a sense of the riskiness of the Yale model. But, once the crisis losses are not counted, the picture changes. Below we show annual standard deviation computed over the 9-year window that starts in July 2009 (FY 2010). The order is completely reversed now and Yale’s endowment is the least risky with 6.2% annual standard deviation, compared to 7.6% for the smaller endowments (up to $500M in assets).
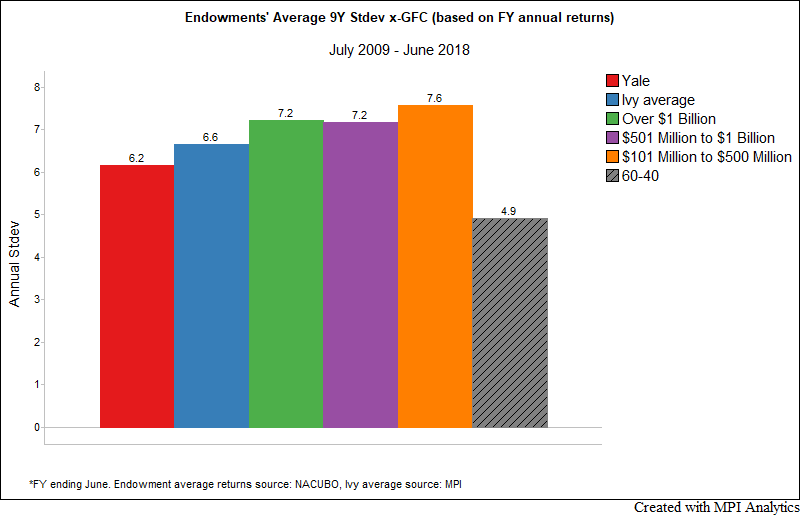
One could view the above chart as a reflection of the Yale model’s attractiveness that drives its high adoption rate – where seemingly less risky assets produce consistently superior results! The devil is always in the details and one needs to realize that Private Equity is also equity that could be highly leveraged (whether through LBO or companies’ balance sheets, or both) and, aside from illiquidity, could carry much higher risks than the public equity portion of the endowment’s portfolio. Until recently, endowment risks were rarely highlighted, with the focus being only on performance.
In the example above, we saw how using annual data could be deceiving in estimating volatility of an investment portfolio, especially when it comes to private market investments. Using our recently introduced methodology, we use asset class exposures derived through Dynamic Style Analysis to create intra-year quarterly proxies for annual endowment returns. We also use a popular desmoothing technique to bring stale and smooth private market data to the common denominator with public market benchmarks. Using 40 quarters of proxy data, we compare the estimated risks of all three endowment size sleeves to Yale’s and the Ivy endowment average, benchmarked to the U.S. 60/40 portfolio. With an estimated 13.90% annual standard deviation, Yale appears to have the highest estimated volatility in the group, 15% higher than Ivy average and 20% higher than large endowments (over $1B in assets). It is also worth noting that the domestic 60/40 portfolio had the lowest volatility by far over the past 10 year window.
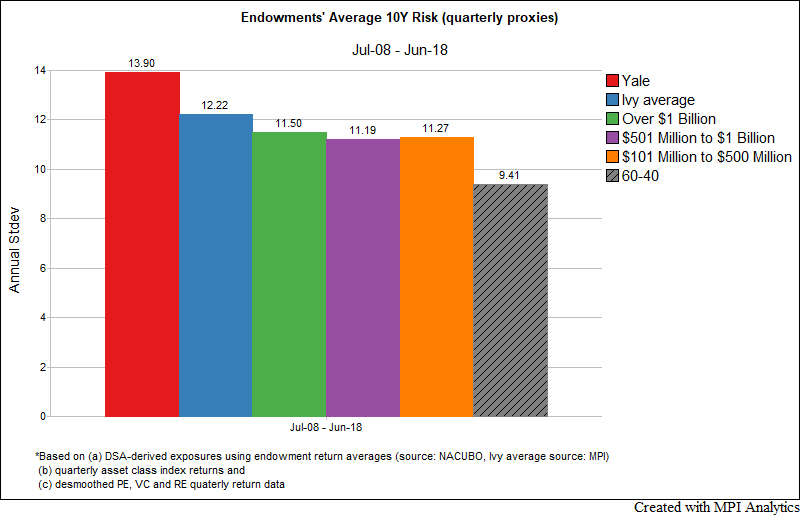
Higher returns, therefore, come at higher costs, and from such top-down quantitative analysis, the Yale model can be viewed over time as simply a leveraged (by 15-20%) endowment portfolio.
We then use trailing 36 quarters to estimate standard deviation with the window not including the GFC. Once the “major stress test” of the GFC is removed from the estimation window, all endowment averages and Yale exhibit similar levels of volatility, unlike we saw in our example with the annual data. As we’ve noted recently, events such as the GFC are important in due diligence and cannot be mechanically removed from risk estimation.
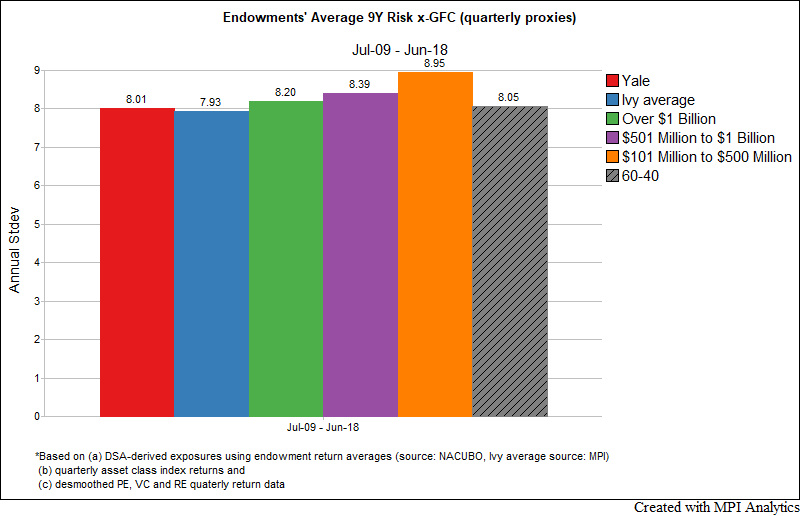
It is important that investors who are mimicking the Ivy or Yale endowment model—especially those who do not have the high risk tolerance levels and/or time horizons of elite endowments—understand and carefully manage the risks of significant allocations to alternative asset classes.
And So…
The average investor does not have the luxury of long horizons that allow endowments to weather significant market downturns and volatility. They may also lack the expertise and resources required to invest (successfully or not) in alternative asset classes―e.g., due diligence abilities, risk and portfolio management, etc.―that the Ivy league endowment investment offices have built over time. In fact, a new survey from Manager Analysis Services questions how capable and well-resourced even large endowments may be for the very significant tasks of performing due diligence on countless prospective managers and strategies, and monitoring all funds allocated to in these large and growing portfolios.
It’s fascinating that the same top-down quantitative tools and methodologies that allow endowment manager researchers, analysts and investment committees to evaluate individual external managers can be applied at the endowment portfolio or category level. By doing so, we can quickly grasp an endowment’s total portfolio exposures and risk characteristics, or the behavior of the entire endowment universe, e.g., increasing allocations to alternatives, without waiting on allocation data from all endowments via surveys.
Footnotes
- 1The domestic 60% equity (S&P 500 Index), 40% bond (Bloomberg Barclays U.S. Aggregate Bond Index) portfolio originates as a traditional benchmark from the pension world to measure a diversified or balanced portfolio against. Since endowments, and particularly large, well-funded ones, have significantly different compositions than a liquid, domestic 60-40 portfolio, including a small allocation to traditional fixed income, global exposure and less liquid, more esoteric private markets assets, as well as different time horizons and funding needs, using a 60-40 as a benchmark for elite endowments is imperfect. Yet, it provides some measure of what a simple, liquid, low cost and diversified model could attain relative to the complexities, illiquidity and higher cost of the Ivy or Yale endowment model. For brevity, we are not suggesting an alternative, more appropriate benchmark in this piece of research. The 60-40 portfolio is rebalanced daily, and returns are gross of trading costs or other fees. Less frequent – monthly, quarterly or annual rebalancing results in returns that vary within the 30b.p. range but we prefer objectivity of the daily rebalancing frequently used in academic studies.
- 2
DISCLAIMER: MPI conducts performance-based analyses and, beyond any public information, does not claim to know or insinuate what the actual strategy, positions or holdings of the funds or companies discussed are, nor are we commenting on the quality or merits of the strategies. This analysis is purely returns-based and does not reflect actual holdings. Deviations between our analysis and the actual holdings and/or management decisions made by funds are expected and inherent in any quantitative analysis. MPI makes no warranties or guarantees as to the accuracy of this statistical analysis, nor does it take any responsibility for investment decisions made by any parties based on this analysis.
Trusted by


Great piece. How do we subscribe to your services? Best, Art
Art – thank you very much! Please visit our Contact page to provide your contact information and areas of interest.