Markov Processes International

Alpha and Excess Return: Not Synonymous

Alpha vs Excess return

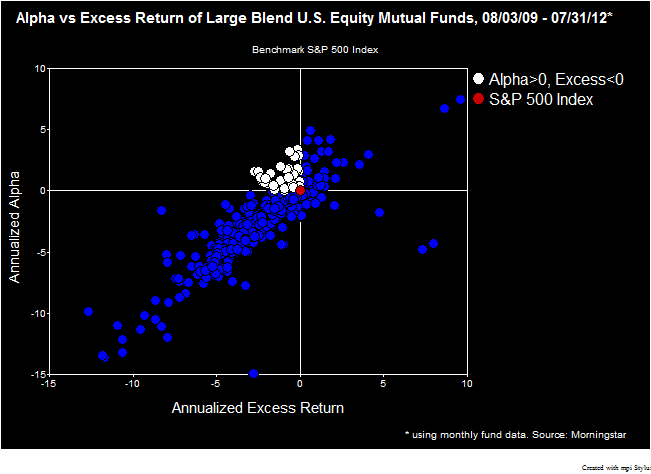
Can a fund whose alpha is positive significantly underperform the market? Yes, it can.

This is a common question we receive during our clients’ Quarterly reporting, so we felt it worth addressing this phenomena – and taking a quick look at funds that gain this distinction.

There is a common misconception that alpha means outperformance or “beating the market”.

Alpha, in its simplest definition, is excess returns to a beta-adjusted market benchmark. A fund with positive alpha but negative excess-market returns typically has beta less than 1. In a directionally upward market, such as we have experienced in the past 3 years, beta lower than 1 is penalizing, and is often the driver in a fund with positive alpha that underperforms its benchmark. A fund can be a great stock picker or selector but, because the fund has low beta, its bets in underperforming sectors can cause the manager to return less than the benchmark.

In fact, looking over the past 3 years, 31 Large Blend U.S. Equity Funds (out of 652 in the category, or less than 5%)1 have met this criteria when measured against the S&P 500, which has returned 48.64% over the period and 14.13% annually.2 Funds from Goldman Sachs Asset Management and GMO are included in this group.

Though underperforming, once adjusted for risk, these funds’ returns are typically more attractive for the investor looking to keep a lid on volatility. In fact, average annualized standard deviation for these 31 funds is 13.5% vs. 15.7% for the S&P 500.

And when we look a little deeper at the 10 highest alpha generators that underperformed the S&P 500 (see the table below), there are a few noteworthy patterns3:

When we look at investment style, however, we note that a number of these funds have significant style biases. According to the Russell-6 Index Style Map chart below, the majority of these funds behave as if they generate a considerable portion of their returns from bets outside of Large Blend U.S. Equity. This can also be seen in the portfolio breakdown of the funds’ style portfolios shown in the right-most columns in the above table.4 For half of the funds, market factors outside of Large U.S. Equity comprise greater than 50% of the style portfolio.

This brings us to the broader definition of alpha – as a measure of a manager’s skill. A common problem when assessing the value a manager provides is the benchmark being used. If a fund is benchmarked to the S&P 500 but has consistently low beta and style and/or market cap bias, the S&P 500 is neither the most accurate benchmark nor the most precise measure of manager’s worth.

Taking the next step in finding a more precise benchmark for a fund requires returns-based style analysis, also referred to as performance-based factor analysis. Once we perform style analysis and then find the static style benchmark (the average weighting of exposures to various factor or style indices over time) we are able to get a much more precise read of a manager’s skill, and a better understanding of how timing and selection drive performance.

We will continue this discussion – and demonstrate how to properly perform style analysis to find a custom benchmark to better measure alpha – in a later post.

Footnotes

Exit mobile version