Markov Processes International

Have Endowments Adopted The Yale Model?

Using MPI’s Common Style to Understand the Endowment Landscape


Dispersion of 2016FY Results

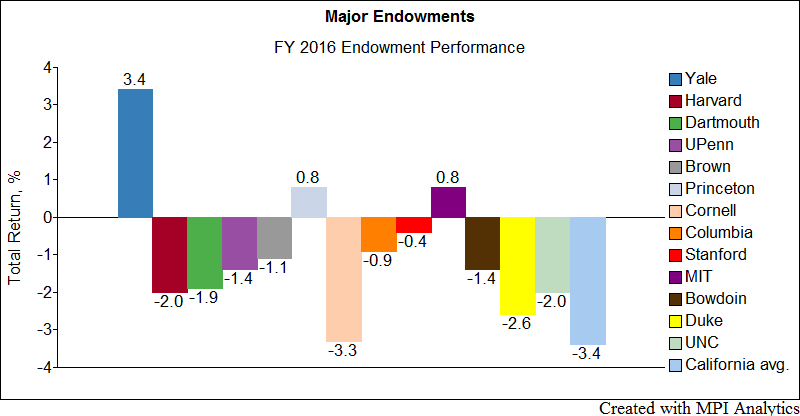
With limited data and only general information about their actual allocations, it can be difficult to identify the causes of the wide dispersion in the returns of endowments in 2016. Note the large spread between the highest and lowest performing endowments in FY2016 in the chart below (we added some additional schools to our previous analysis):


Aside from Yale, which had the best FY2016 performance, only two other schools in this group scored positive returns: Princeton and MIT. Have they adopted the “Yale model” or are there other strategy insights that can be identified through a quantitative analysis? Comparing asset allocations can be misleading because the actual allocations may differ substantially from what is reporting and proxies for asset classes can vary between endowment portfolios. In addition, various asset management products used by endowments have wide mandates, like hedge funds, that often make large and unforeseen bets that can substantially alter the effective asset allocation of an endowment portfolio. With limited transparency on some of these funds, the effective asset class exposure information may not be entirely accessible to the endowments themselves.


Why Common Style?

Looking at the correlations of publicly available annual endowment returns to measure the similarities of endowments’ investment “styles” is, in our opinion, not the best approach as endowment portfolios vary over time when asset managers adopt new strategies and reshuffle funds. In addition, correlations themselves could be misleading as similarity of co-movements between endowment returns in the past may have little relation to their allocations: some asset classes move together at times and then diverge for an extended period of time.

To better understand the similarities in endowment investment “styles”, we used MPI’s proprietary “common style” technique. Common style measures the similarity in factor exposures (betas to individual factors) between two portfolios. To calculate this statistic, we first identify a list of factors to help explain the endowment portfolios. We then measure the degree to which each endowment has similar factor exposures to the others endowment portfolios.  For example, if one portfolio had 60% equity and 40% fixed income, and the other had 50% equity, 30% fixed income and 20% real estate,  their common exposures would be : 50% equity plus 30% fixed income = a common style of 80%

In the chart above, we see the Common Style Matrix for 15 selected endowments based on the latest factor exposure results from our FY2016 analysis . This heat map shows the highest common factor exposures as dark orange and the least common as light blue. One immediate takeaway is that both MIT and Princeton have the highest common style with Yale: 77% and 78% respectively. The same does not hold true for the lowest performing endowments. As we observed in our previous study, only a few specific factor exposures were responsible for most of the gains this year, Private Equity, Real Estate, US Equity and Bonds, while more exposures drove losses. We can also see that $10B UPenn endowment investment model differs substantially from the Ivy “pack” and is closer to smaller endowments (something we also observed in our FY2015 study), while the $7B Duke endowment is even further away from the rest of the schools in the study. While it’s always true that a quantitative analysis such as this is subject to the factors selected (or not selected), the time period used and the credibility of the results, when done properly, it can yield key insights and information that correlation analysis and limited holdings cannot.

Stay tuned for our next post with the focus on risk and performance efficiency of endowments.

Exit mobile version