A Private Equity Liquidity Squeeze By Any Other Name

How the anemic deal climate, record low distributions and massive unfunded capital commitments are pushing endowments further into illiquid private equity & venture capital, increasing risk & leverage in portfolios (and markets broadly)

July 15, 2024

Related research: The Great Private Equity Squeeze of 2023Top Hedge Fund Managers Agree on SomethingFY2023 Ivy Report Card: Volatility Laundering and the Hangover from Private Markets Investing

Yesterday’s Liquidity Lesson: Credit Crunch and the Escape Valve

The depths of the global financial crisis (GFC) were a nauseating time. Stocks plunged, valuations crumbled, liquidity froze as the market for both deals and basic financing seized up, and counterparty risk surged. Distributions from general partners “slowed to a trickle” while capital calls on limited partners, like Harvard Management Company and other endowments following the “Yale Model”, continued. LPs had to pay up. Between the collapse of Bear Stearns and the failure of Lehman Brothers, with an endowment then valued at $36.9B, Harvard had $18B in non-marketable assets (PE + VC + real assets) and over $11B in unfunded commitments, along with $8.3B in hedge funds[1].  Taken together, Harvard’s illiquid exposures and unfunded commitments (expected capital calls) were 79% of the endowment’s total value (AUM and unfunded commitments). In this acute liquidity crisis, Harvard leaned on its sterling Aaa credit rating and borrowed $2.5 billion in late 2008 to plug a funding gap.

The situation was worse at other Ivy league schools; allocations to private funds and illiquid investments coupled with unfunded commitments exceeded 100% of total endowment value at Yale, Princeton and Columbia.

Historic monetary and fiscal easing measures, coupled with low inflation, sparked a V-shaped rebound. Financial conditions loosened, valuations rose and the deal tap got flowing again, helping to rescue many endowments employing the Yale Model. It had been a harrowing time of budget cuts and haircuts. Many university leaders and endowment chiefs promised alums they’d learned a lifelong lesson in risk and liquidity management.

Today: “Worst Ever” PE Liquidity Environment

Though stocks have rebounded smartly off their 2022 bear market lows (SPY is >50% above its October ’22 nadir), things haven’t been going so well in private equity and venture capital. Reiterating this point, in April, Princeton’s Andrew “Sparky” Golden, the legendary outgoing CIO at PRINCO, told Financial Times this has been the “‘worst ever environment’ for liquidity” in private equity.

The breathtaking pace of the Fed’s rate rise cycle to combat the worst inflation since the 1980s impaired the deal climate for financing rounds, M&A and IPOs. Transactions stalled with GPs, portfolio companies and founders wary of undercutting heady valuations from frothier times. Many have held out, hoping for rate cuts that that keep getting pushed back. After fundraising surged in the easy money years of the pandemic (2021 and 2022 saw record fundraising), a slowdown in deals[2] has led to record amounts of dry powder ($2.6T in December, per S&P GMI).
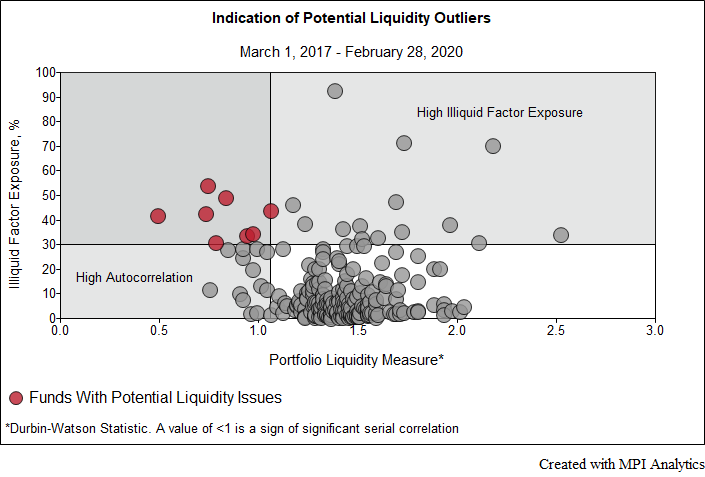
Deal value was down a staggering amount in 2023 from 2022. Estimates vary—with KPMG saying PE deals were off -45% in 2023 to $425B while S&P Global data suggest global PE/VC deal volume was down -40.3%, from $436B in 2022 to $260B in 2023—but dropping off a cliff is the theme.

“DPI is the new IRR”

Cumulatively, this has limited the amount of money that is being returned to LPs—like endowments—in the form of distributions. Those distributions have become a highly depended on source of funding for not only university budgets, but further allocations to private equity managers themselves.

Cash distributions to LPs fell to 11.2% of funds’ NAVs in 2023, the lowest level since the GFC and far south of the 25% median of the past 25-year period, according to Raymond James, while Cambridge Associates estimated distribution yields from US PE firms at 9%. Based on a survey of five of the largest private equity managers, Bloomberg pinned the drop in distributions at -49% in 2023 from 2021’s levels.

LPs wearing T-shirts stating “DPI is the new IRR” seems to have led PE firms to get creative in order to return capital to investors. The practice of seeking NAV loans—often to encourage investors to allocate to new funds—“has exploded in recent years”, according to Bloomberg News.

Continuation funds, which allow GPs to sidestep deeper losses while returning capital to investors who seek distributions, have become increasingly popular. Further telling of pressure to return capital to LPs, the secondary market for VC has also “exploded”, according to Financial Times. Trading volume growth has been >50% year-over-year through May, per Caplight data, and discounts from prior fundraising rounds of 45% to 50% have been prevalent, according to Lightspeed Ventures.

Endowments: “Don’t Call It a Cash flow Issue”

It is amidst this environment that Ivies, fortunate to have pristine Aaa credit ratings, have tapped the bond market for financing needs – including Harvard, who announced a $1.65B issuance in February; Princeton, who also came to the market in February and then again in quick succession in March for a total of $1.47B, and Cornell, a rare issuer (Aa rated by S&P) who outlined plans to borrow $1.1B in April. All decided to come to market with the 10-yr Treasury over 4% and federal-funds rate at over 5%. Only two years prior in Q1 2022, the 10-yr was trading around 2% and the benchmark rate was under 50bps.

While the schools haven’t mentioned liquidity issues (naturally!), some have. Harvard denied their issuance had anything to do with cash flow issues and pointed to short-term reserves ($1.4B) and a line of credit ($1.5B).

And with stock markets in a new bull market, spreads at their tightest since 2007 and bonds yet to emerge from their longest ever drawdown, we’re certainly not in 2008 or 2009.

Digging In – Elite Endowment Liquidity and Risk Analysis

But given the first more normalized rate environment since many college endowments followed the elite schools’ Swensen acolytes into alternatives and private markets, there are a lot of questions, including:

  • How tight is the liquidity squeeze at elite endowments? And, should distributions from PE + VC firms remain depressed, how much tighter could the squeeze get at endowments as further capital calls come in?
  • How can endowments manage liquidity challenges? Would they sell more liquid holdings, like stocks and bonds? Or might they be turn to the secondary markets to offload PE – often at a sizable discount?
  • Could we see more schools financing through debt issuance? But what about schools that don’t have the luxury of a solid credit rating?
  • Further, looking at the big picture, could there be systemic risk to markets should LPs be squeezed in such a way that triggers a negative feedback loop through markets (both private and public)?
  • And what would happen if public equity were to sell off while the Fed couldn’t return to as accommodative a posture due to the inflation genie not yet being back in the bottle?

We decided to kick the tires to assess endowments’ liquidity-associated risks. Contrary to our usual top-down approach when analyzing returns of endowments to understand the likely exposures driving their returns and risks, we dove into schools’ latest annual financial statements[3] to take a bottom-up approach. This wasn’t simple, and these aren’t hours we’ll soon get back. While we’re not sure this is something we endeavor to do each year, the results are enlightening.

For simplicity, we limited our analysis to PE + VC, and omitted other asset classes seeking to harvest an illiquidity premium, like real estate and hedge funds. We focus on Private Equity (PE+VC) exposure as the main source of risk and stress due to its highly illiquid nature and its prominence in the Yale Model (24%-45% of the AUM for Ivies).[4]

The charts displayed here are now available on MPI’s Transparency Lab under the “Liquidity” tab in the endowments section of the site.

Interpreting the “Elite Endowments Liquidity Stress Map” diagram:

  • Generally, the higher the portion of an endowment’s PE allocation that is unfunded (X-axis) -> the younger the average vintage of an endowment’s PE portfolio -> the lower the cash distributions from the LP’s PE portfolio likely are -> the less money the LP will have on hand that can be allocated to future capital calls from the GPs (and a school’s budgetary needs).[5]
  • PE is one of the most illiquid assets in an endowment’s portfolio. The higher an endowment’s allocation to PE is (Y-axis), the greater the liquidity stress that could arise in a time of crisis.
  • “Ivy Average” could be used as a reference point for both stress and exposure to PE of individual endowments.
  • Size of the dots corresponds to assets in an endowment.

Some Takeaways from the Endowments Liquidity Stress Map:

  • The Ivy/elite endowment average FY2023 PE allocation is ~37% (% of total endowment assets), with ~26% of the total PE allocation (the amount allocated and committed capital) being unfunded.
  • Brown’s unfunded PE allocation of approximately 34% suggests their portfolio, with an above average allocation to PE of 40%, is the youngest of the elite endowments by vintage. As such, Brown could see lower distributions and higher calls on capital in the near- to mid-term.
  • Dartmouth and Cornell appear to have the most mature PE portfolios by vintage – suggesting more substantial distributions and lower capital calls relative to peers – while Cornell has the second lowest allocation to PE.
  • At 45% of their portfolio, Yale’s statement suggests they have the highest allocation to PE, though it appears to be more mature than the average elite endowment given a 24.4% unfunded portion.
  • While Columbia shows the lowest allocation to PE at under 25%, its PE portfolio would seem to be less mature given its >31% unfunded level.

The chart above demonstrates what we refer to as “liquidity pain”. Here, again, we show the portion of endowments’ PE allocations that are unfunded and then measure that $ figure’s ratio to liquid assets in each endowment. Why? The funding of capital calls typically comes from two sources:

  1. The liquid portion of the endowment portfolio and
  2. Distributions from the existing allocation to PE.

Both sources of funding represent risks, which are illustrated as bars in the chart titled “Liquidity Pain”:

  • The higher the ratio of unfunded PE commitments to the liquid portion[4] of an endowment, the greater the challenges for the endowment to meet capital calls. This pain would be heightened should liquid assets experience declines in value.
  • The higher the unfunded portion of a PE allocation is, the lower the cash distributions will likely be from GPs that can then be allocated towards future capital calls.

Some Takeaways on the Liquidity Pain chart:

  • The Ivy average unfunded PE allocation as a percentage of liquid assets is 44%, while its unfunded PE commitments are at 26% (of the total allocated and committed capital).
  • Brown’s liquidity pain potential is significant. In addition to leading the group of elite endowments in unfunded portion of PE allocation, their unfunded PE as a percentage of liquid assets – at over 78% – is significantly higher than peers.
  • While its slightly above average unfunded commitments aren’t staggering, Harvard’s unfunded PE as a percentage of liquid assets at 60% stands out. Though it is well under Brown’s level.
  • Princeton’s above average ratio (52%) of unfunded PE to liquid assets is noteworthy.
  • Yale is close to the average in both measures, though if one were to exclude Brown, given its outlier nature, Yale’s unfunded PE as a percentage of liquid assets would be third in pain.
  • Though Columbia appears to have made a significant recent push into PE as noted, their unfunded PE as a percentage of liquid assets is well under the average, suggesting a relatively balanced portfolio and perhaps more careful risk management.
  • At 19%, Cornell has the lowest unfunded PE to liquid assets ratio. Dartmouth’s conservative positioning stands out for its relative painlessness as well.

Since market drawdowns exacerbate liquidity pains, liquidity risk and market risk should not be looked at in isolation. The above diagram, “Liquidity and Market Risk”, compares endowments’ estimated market risk (X-axis)[6] with liquidity pain or risk, defined as the ratio of unfunded PE commitments to the liquid portion[7] of the endowment portfolio.

Some further takeaways:

  • MIT’s portfolio behaves with the most risk currently, followed by Brown, Princeton.
  • Brown stands out again; the endowment has high market risk combined with high liquidity risk, as noted above.
  • Columbia shows the lowest market risk, perhaps benefiting from an asset allocation that is quite balanced with a higher-than-average allocation to hedge funds (see discussion below).
  • While Dartmouth’s liquidity risk is low, as prior noted, its market risk is a jump above average. Per the Endowment Asset Allocation chart below, this could be related to a higher-than-average public equity allocation, a lower-than-average hedge fund allocation and a PE allocation that has grown higher than the average Ivy or elite endowment.
  • Yale and Penn cluster with the Ivy or elite average.

The actual dollar amounts of unfunded commitments add an extra layer to our liquidity analysis. Higher amounts of unfunded commitments could lead to exponentially greater liquidity stress, assuming all other factors remain constant.

The asset allocations above are derived from financial statements or, in the minority of instances, reported by the schools. The Ivy or elite average, the rightmost bar, is helpful when analyzing individual endowments. The average elite endowment has a roughly 37% allocation to PE. The more liquid portions of portfolios, stocks (20%) and cash+bonds (10.5%), come out to about 30% of the average elite endowment.

Increasing Illiquidity and Bloated PE Allocations

At the end of fiscal year 2023 (June 30th), the average Ivy had 36.7% of their endowment in private equity (PE + VC), based on our review of annual reports and/or financial statements. Our returns-based analyses of Ivies, extending back to fiscal year 2015, have shown a trend of increasing PE + VC exposure.

Endowments broadly have been following the Ivy League’s lead, increasingly adopting the Yale Model for decades. According to the 2023 NACUBO-Commonfund Study of Endowments, 29% of $839 billion in endowment assets across the 688 surveyed endowments are allocated to private equity (17.1% in PE and 11.9% in VC)[8].

Add the 15.9% allocation to hedge funds and 11.2% allocation to real assets and the universe of endowment assets is well over 50% in alternatives of various illiquidity levels. Up until the year 2000, the aggregated alternatives allocations were under 10% of the endowment asset pool.

The average endowment portfolio today is basically unrecognizable to the days when NACUBO’s first reports were published. Such complexity brings new challenges to aspects of cash flow, allocation and risk management.

Modeling (Cash flows) Isn’t Easy

Even in ‘normal’ times with more regular distributions and predictable alumni contributions, keeping allocations to PE within target allocation bounds isn’t easy. Endowments and other LPs considering increased private markets allocations could learn from Princeton’s example; their 40% allocation grew one-third over their 30% allocation target. As Golden told FT: “‘It wasn’t that I was sorry about the target we set,’ [Golden] said, referring to the 30 per cent private equity allocation goal Princo has exceeded by a wide margin. ‘It turns out that our analysis was somewhat mistaken as to how much we should commit to get there, and we just committed too much.’”

In aggregate, the liquidity challenges since 2022 have likely worked to squeeze endowments’ further into PE. It is normal for a GP to call 20% to one-third of an LP’s committed capital in the first few years of a fund. Particularly for LPs who dove in and committed more to PE in recent years, the lower distributions from older vintages and minimal distributions typical of newer vintages are likely exacerbating the squeezing sensation as capital is called.

There looks to be more artful navigating ahead. Some assumptions and back-of-the-envelope math on the dry powder suggests LPs will need to put up a significant portion of $2.6T in the coming 3 years. If half of that comes from distributions (a big if should ‘higher for longer’ and a moribund IPO and deal climate prevail), that means ~$400B in capital will be required from LPs each year.

In a normal year, cash distributions from PE funds of 25% of PE NAVs would (more than) fund LP capital calls. With distributions more than chopped in half from the long-term average of 25%, the pressure to fund capital calls mounts, potentially increasing liquidity pain.

This could mean LPs sell stocks and bonds to fund commitments. How much could there be to trim?

As seen in the table at the bottom of the Liquidity tab in the MPI Transparency Lab, elite endowments average 30.6% in liquid assets (stocks, bonds & cash). Princeton has the lowest allocation to liquid assets (21.6%), followed by Harvard (25.3%), while Cornell (36.7%), Columbia (35.7%) and UPenn (34.9%) show the highest allocation to liquid assets.

The degree to which this pain is limited to endowment (and other LP) portfolios and not markets more broadly is another matter worth pondering. From the GP side of things, regulators have been increasingly expressing worry about systemic risks within private markets. SEC chair Gary Gensler recently voiced concern to Financial Times à la “LTCM spillovers”, and the European Banking Authority’s Jose Manuel Campa has been eyeing “the interrelationships”, per Bloomberg News. But the butterfly effect of LPs’ liquidity issues and resultant stresses to private and public markets also have a part in the broader equation.

Returns, Expectations and Leverage

While this is not intended to be a discussion of asset class returns, the appropriate measurement for PE performance, nor expectations, these topics deserve to be addressed briefly as they relate to increasing PE allocations.[9]

Schools with simpler, more 60/40-like portfolios less exposed to private markets, particularly VC, and more weighted to stocks outperformed those employing the Yale Model by a significant margin in 2023. And the hangover in PE as valuations sober up appears to be continuing—especially relative to stock benchmarks, which continue to rise, driven by select mega-caps.

For those schools who are trimming from elsewhere, like stocks and bonds, or selling on the secondary markets to add new money to PE, what is the outlook for the asset class?

Though pensions aren’t endowments, of course, they offer a bit more transparency and reporting, and as such can serve as a guide here. CalPERS’ review of PE accompanying its decision to increase its target allocation – which showed modest anticipated outperformance of equities – and Robert Armstrong’s incisive analysis of that call is very instructive. Intense competition amongst GPs to put capital to work[10];  higher interest rates than those that prevailed during the golden post-GFC period in when PE outperformed stocks[11]; and the leveraged nature of PE (amplifying US equity beta, an asset class that has significantly outperformed since the GFC) leaves room for disappointment.

In defending a rare decision to pare PE exposure in 2023, Marcus Frampton, the CIO of Alaska Permanent, told a trustee (none other than Gabrielle Rubenstein, a PE exec and Carlyle co-founder David Rubenstein’s daughter), “I feel like the PE market needs a reset; I find the opportunities there unattractive”, as reported by FundFire. Speaking to FundFire later, he reiterated, “It’s a good time to be cautious [on PE]”).

That echoes worries from the VC world over the froth associated with the AI boom (is it a bubble yet?). At Milken, PitchBook reported tech entrepreneur and VC investor Elad Gil saying, “99% of the companies are going to be awful, overvalued and in many cases, fail. Everybody, including myself, we’re all investing in the 1% and we’re probably wrong.” Priya Anand of Bloomberg News reports a two-tiered VC world, where companies not focused on AI are struggling: “It’s a sign that there’s a tale of two types of startups right now. The most promising ones that are focused on AI are raking in cash. The rest are fighting for scraps.”

And despite the volatility laundering associated with book-value accounting, PE has shown to be excessively volatile and to increase portfolio volatility overall. CalPERS listed PE volatility at 28%, leading a 12% PE allocation to account for 25% of total portfolio volatility. Growing allocations to PE at the expense of liquid asset classes serves to leverage a portfolio, whether an endowment or a pension, as seen in the risk/return tab within the MPI Transparency Lab.

What is the current case for increasing PE allocations, like CalPERS or Alaska Permanent—whose late-May volte face from 2023’s decision to decrease their PE target stood out—or tolerating PE allocations so high above targets, like Princeton? Has the outlook for PE, which tends to lag stocks, suddenly changed so significantly after the public equities rally, or are decreased distributions forcing LPs’ hands?  How strategic of an asset allocation alteration such tailoring amounts to is certainly up for debate in the “worst ever” PE liquidity environment.

More and more, LPs either being over target on PE or increasing their PE targets looks like a product of mismanaged cash flows, unimaginative risk management and a poorly timed (over)commitment to illiquid assets.

Funding Needs and Implications

University budgets have become increasingly reliant on endowments. Per NACUBO (H/t Financial Times Alphaville), the average university budget that was derived from endowments in the 70’s was 4%. Today, over 17% of “larger, better-endowed” schools’ budgets are funded from their endowments.

Endowments needing to raise capital for their budget and unfunded commitments called by GPs could turn traditional asset managers—who oversee more vanilla mandates for those LPs—into ATMs. Indeed, large managers of majority public markets securities said outflows were driven by institutional managers in 2023. FundFire reported Q4 was “especially rough”. And that “many institutional managers took a beating last year [2023], as big investors redeemed mandates and held onto their cash”. And hedge funds have blamed a lack of inflows on the dearth of PE distributions to the same LPs with whom they compete for alternatives allocations.

The secondaries market could be a destination for some endowments should LPs find no other choice but to stomach selling at a discount to free up cash for budgets and capital calls to PE firms. PEI reported in April: “By and large, LPs are coming to market to sell off stakes in non-core funds and relationships to free up capital and make room for commitments into new funds.”

Lastly, we would not be surprised to hear about more schools with solid credit ratings issuing debt should the deal climate not improve soon.

Looking closer at Harvard’s current financial statement once again, we see that the school appears to be in a curiously similar (il)liquidity position to where it was in June 2008. The percentage of total illiquid assets combined with unfunded commitments to PE and other asset classes relative to the total portfolio value is 79% yet again[12]. And this is peace time for stocks and public markets. Whether one believes Harvard’s denial that their recent bond issuance had anything to do with cash flow issues, it would be hard to argue that it is not a good time for them to raise funds.

For smaller schools and newer investors in illiquid alternatives, however, a word of caution from this current moment of relative tranquility for the liquid portions of endowment portfolios is warranted. It is one thing to attempt to follow the Yale Model and pile into private equity. It is another thing—with a much lower probability outcome—to achieve the long-term results of Yale in doing so. But it is something else entirely, impossible really, to replicate a Aaa credit rating to save an operating budget and honor commitments to GPs at precisely the moment when funds are needed—especially should public markets face stress and declines in value when that next capital call comes in.

 
[The charts displayed within this post are now available on MPI’s Transparency Lab under the “Liquidity” tab in the endowments section of the site.]

__________________________________

[1] As of 6.30.2008, according to “Alternatives and Liquidity: Will Spending and Capital Calls Eat Your ‘Modern’ Portfolio?” by Laurence B. Siegel, director of research at Ford Foundation, as featured in Grant’s Interest Rate Observer “Alma mater over her skis”. Vol. 41, No.15a. July 28, 2023. For “total endowment”, Siegel adds an endowment’s unfunded commitments to the endowment’s AUM, e.g., Harvard’s total endowment of $47B is comprised of $36.9B AUM + $11B in unfunded commitments (expected capital calls).

[2] Particularly in VC where 2023 saw only a third of the record $555 billion raised in 2021, per Pitchbook as reported by Financial Times. Annualizing the $30.4B raised in Q1, 2024 is set to be the “slowest year since 2015”.

[3] Endowment asset allocation numbers were derived from 2023 endowment annual reports/financial statements except for Brown, Princeton and Harvard, which published endowment asset allocation information. Because financial statements cover the schools’ general accounts, which contain non-endowment assets, the computed allocations may differ slightly from actual. For Yale, in 2023 this is 7.2% of net investments, for Dartmouth 12.7%. Liabilities or other assets that are present in the annual reports and/or financial statements and can’t be classified are omitted from the charts due to uncertainty of their nature. For Yale, for example, in 2023 this represents 4.6% of net investments.

[4] Private Equity (PE) exposure as labeled in the charts includes Venture Capital (VC) because most endowments report PE (buyout and growth) and VC allocations combined. In the rare occasions where they are listed separately in financial statements (e.g., Brown and Yale), we combine them.

[5] Said differently, how funded or unfunded an endowment’s PE allocation is (X-axis) typically corresponds to average fund maturity/age, which in turn has a relationship to the likelihood of cash distributions from the PE portfolio. Such distributions can be allocated to future capital calls.

[6] For market risk, we use annualized standard deviation estimates based on the most recent estimated fund exposures (obtained through dynamic analysis of endowments’ annual returns) and quarterly returns of risk factors over 10-year trailing estimation window. Disclaimer: Market risk estimates are based on exposure estimates obtained through quantitative analysis and, beyond any public information, MPI does not claim to know or insinuate what the actual strategy, positions or holdings of the funds are, nor are we commenting on the quality or merits of the strategies. Deviations between our analysis and the actual holdings and/or management decisions made by funds are expected and inherent in any quantitative analysis. MPI makes no warranties or guarantees as to the accuracy of this statistical analysis, nor does it take any responsibility for investment decisions made by any parties based on this analysis.

[7] For liquid assets we use the sum of Cash/Short-term, Bonds and Equity allocations. Not all of it could be available on daily, monthly or quarterly notice. The actual liquid assets could be significantly less than the stated number.

[8] Total allocation to PE amongst 688 endowments representing $839B on a dollar-weighted basis. NACUBO’s report provides allocations for endowments grouped by asset levels. In lieu of having a median, we opted to use this figure.

[9] The former will be more thoroughly addressed in our analyses after fiscal year 2024 wraps up and endowments begin reporting performance.

[10] This phenomena seems to now be plaguing the private credit market, which has seen record dry powder accumulate after years of breathtaking fundraising, per Bloomberg.

[11] CalPERS’s performance review shows PE returns of 11.4% over the recent 10-yr period and 12.3% over 20-yrs, vs. 7.9% and 7.6% for public equity, respectively.

[12] Per Laurence Siegel’s 2008 analysis and the logic cited prior and using the $59B pooled general account that includes endowment assets and other operating and related accounts, as stated in Harvard’s FY 2023 financial report. The percentage of total illiquid assets (74% ($44B) of the $59.2B total general account is spread across PE, Real Assets (Real Estate and Natural Resources) and Hedge Funds) combined with $9B in unfunded PE commitments and another $4.3B in unfunded commitments to other asset classes relative to the total hypothetical account value of $72.5B (AUM + unfunded commitments) is 79%. We don’t necessarily agree with Siegel’s assumptions, as they assume that the funding of capital commitments (CC) will come from external sources rather than from PE distributions and liquid assets. A more realistic assumption is that funding is internal and equally divided between distributions and liquidity. In this case, the PE position is increased by 50% of CC, while AUM remains unchanged. Following this logic, Harvard’s ratio of illiquid assets, 85% as of June 2023, is still remarkably similar to that in June 2008, which was 86%.

Tags
Comments
Leave a Reply
Fields to complete: