The Oracle of Tampa and the Modern Portfolio Theory
The fund’s star manager may dismiss Modern Portfolio Theory – but MPT has no trouble explaining his returns.
At first glance, the recent Bloomberg article on the $3.2 billion City of Tampa Fire and Police Pension Fund reads like a referendum on Modern Portfolio Theory (MPT). To paraphrase the protagonist, Harold “Jay” Bowen III – the fund’s sole portfolio manager – his strategy is simple: observe the markets daily, make stellar stock picks, and outperform all the “eggheads” armed with sophisticated risk management tools.
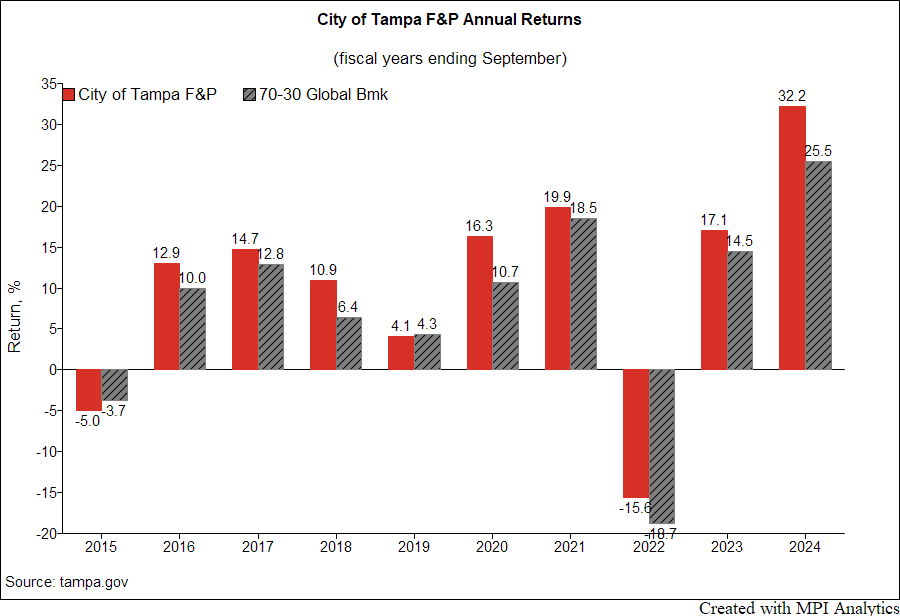
That, essentially, is what Bowen and his nine-person firm, Bowen, Hanes & Co., have done for decades – running a straightforward portfolio of mostly stocks and bonds, while consistently outperforming peers in the Wilshire Trust Universe. For context, the pension fund posted a 32.2% return in its fiscal year ending September 2024.
Like many profiles before it, the article recounts the firm’s 50-year history of spectacular stock picks – Coke, Apple, and, more recently, Nvidia in 2019 – mirroring Buffett-esque performance. Bowen even openly mocks MPT’s core tenet that volatility equals risk.
And yet, ironically, Bowen’s track record is one of the strongest affirmations of MPT – the same theory for which Markowitz, Merton, and Sharpe won the Nobel Prize in 1990.
The world, one might say, divides into two camps: those who can watch magic tricks endlessly with awe, and those who leave a magic show sleepless, desperate to uncover the trick. MPT was invented for the second group – those who prefer to demystify returns and sleep soundly without needing melatonin. Some managers use factor models and risk analytics; others, like Bowen, rely on their intuition. Some pensions deploy BlackRock’s expensive Aladdin system to dissect portfolio risks; others entrust everything to one manager’s instincts. Either way, everyone wants to sleep well at night.
But whether investors acknowledge it or not, MPT operates under the hood. To demonstrate this, we used Professor William Sharpe’s returns-based style analysis (RBSA) via the MPI Stylus Pro system.
RBSA is one of the strongest validations of Modern Portfolio Theory: in a diversified portfolio, individual stock bets either offset each other or coalesce into broader themes, enabling the portfolio’s performance to be replicated or explained using a long-only mix of generic market indices or factors – without any knowledge of the actual holdings. The key lies in selecting indices that plausibly reflect the manager’s investable universe. While the short return history (annual returns for pensions) presents a challenge to traditional regression methods, modern dynamic models can still extract meaningful and robust estimates.
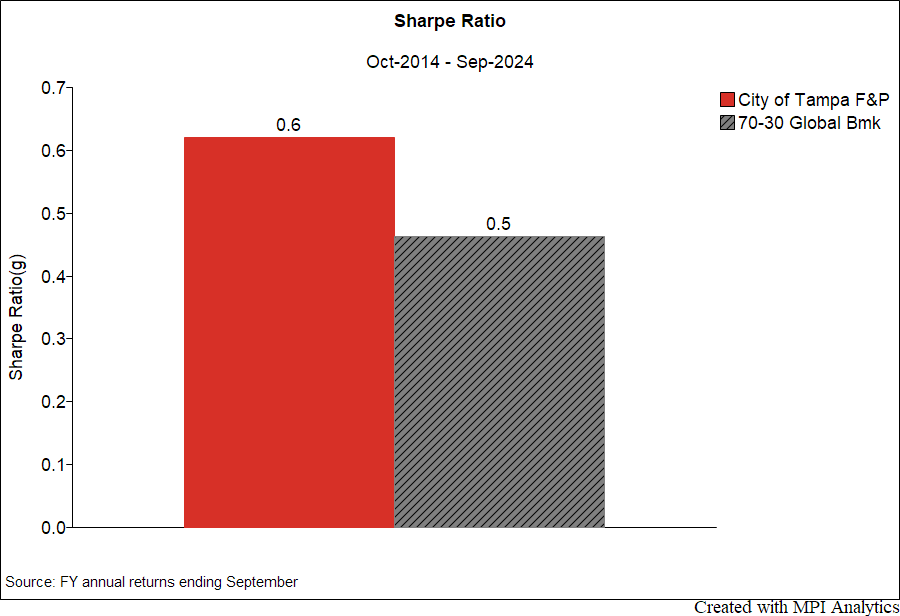
We’ve obtained the 10 most recent annual returns from the City of Tampa’s Fire and Police Pension website.[1] The chart below compares the pension’s fiscal year returns (ending in September) to a quarterly rebalanced benchmark of global equities (70% in MSCI ACWI Index) and U.S. bonds (30% in Bloomberg U.S. Aggregate Bond index). The results? Bowen’s portfolio outperformed this equity-heavy benchmark in all years except for FY2015 and a tie in FY2019.
Using only annual fund returns as input, MPI Stylus Pro’s dynamic factor model creates a long-only portfolio of market indices which credibly (and predictively) mimics the fund’s return. We also perform a similar analysis of the 70/30 benchmark and show both results below side-by-side for comparison.
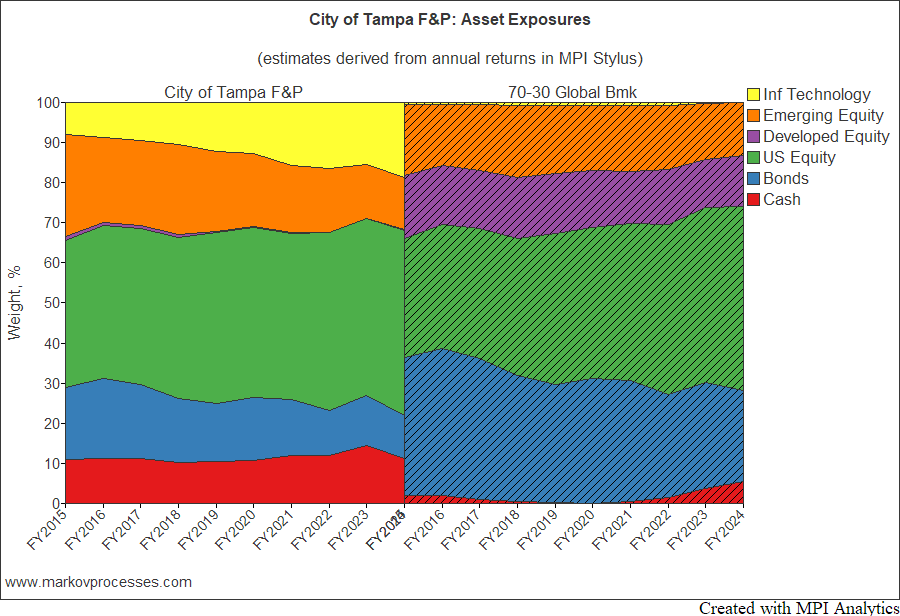
These are some takeaways:
- Significant overweight to Information Technology stocks, similar to allocations seen in top-performing endowments like Brown and Michigan State.
- Matching exposure to U.S. and emerging markets equities, validating the appropriateness of a 70/30 global equity/bond benchmark.
- Minimal exposure to developed markets outside the U.S., except indirectly via ADRs in the S&P 500.
- Notably low bond exposure and more short-term relative to the benchmark.
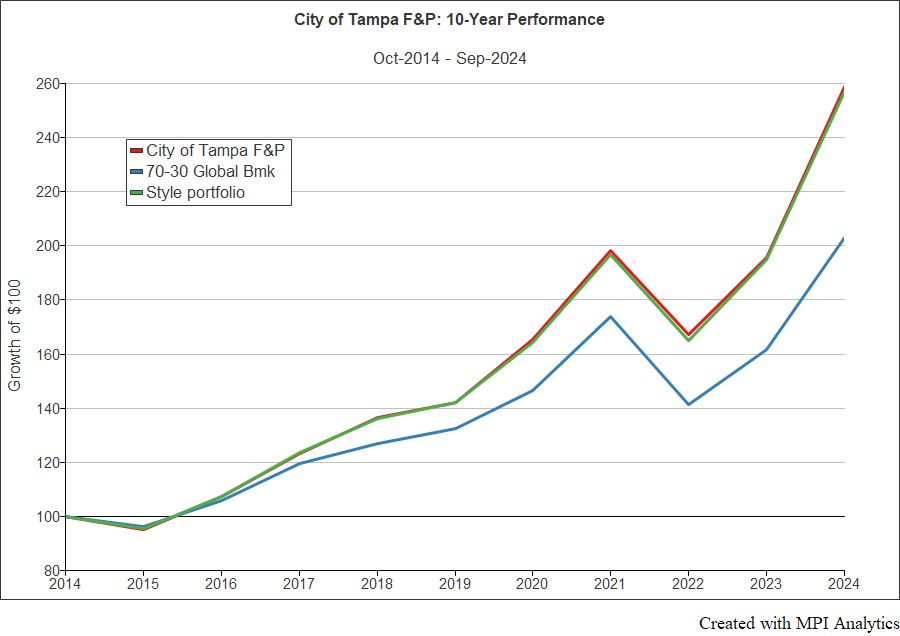
The punchline: our factor model achieves an R-squared of 99%, even after cross-validation using MPI’s proprietary machine learning tools – indicating that this isn’t a case of overfitting. A portfolio composed of standard indices with the identified exposures (green – in chart below) effectively replicates Bowen’s performance (red).
This highlights a key legacy of MPT: once a portfolio reaches a certain size, individual stock picks blend into thematic exposures – like the “Magnificent Seven” tech stocks. Active managers spending their days on bottom-up research might want to reflect: could similar results be achieved with a handful of ETFs, à la Nevada PERS?
Saves time and money with MPI’s comprehensive software platform that provides both historical and forward-looking analysis capabilities
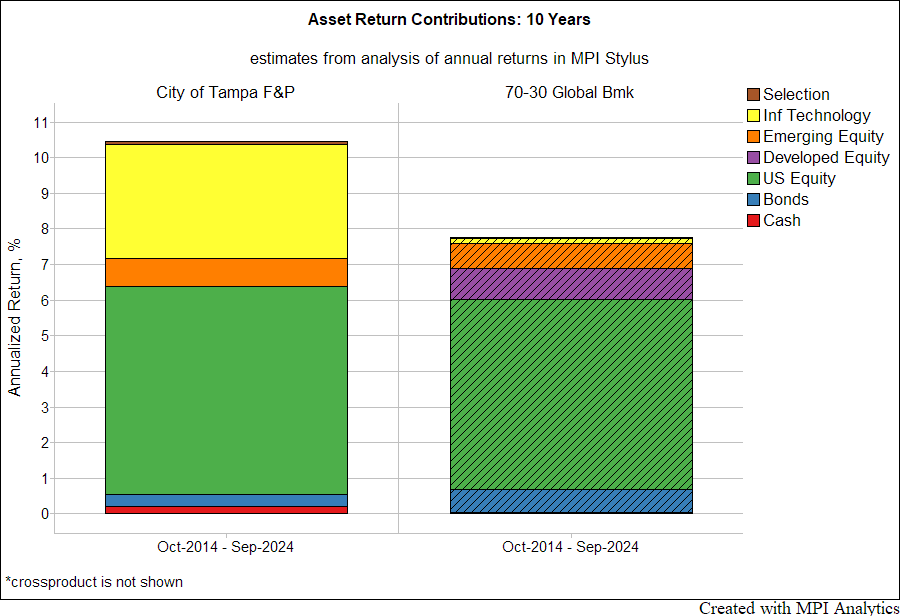
So, what’s been driving Bowen’s outperformance over the past decade? The Stylus Pro charts below decompose annual return contributions for both the pension and its benchmark. The conclusion: the portfolio’s tech overweight explains most of the excess return – especially in FY2024.
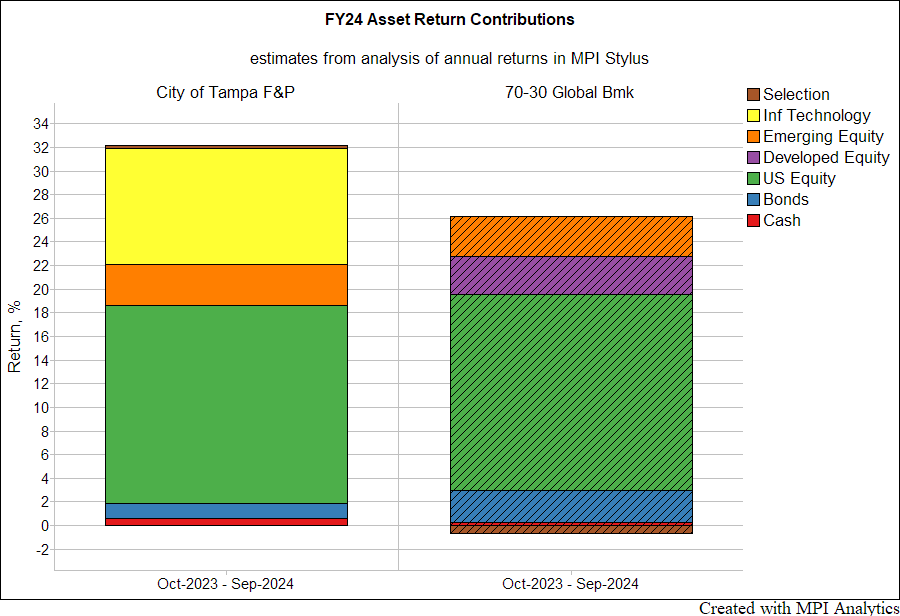
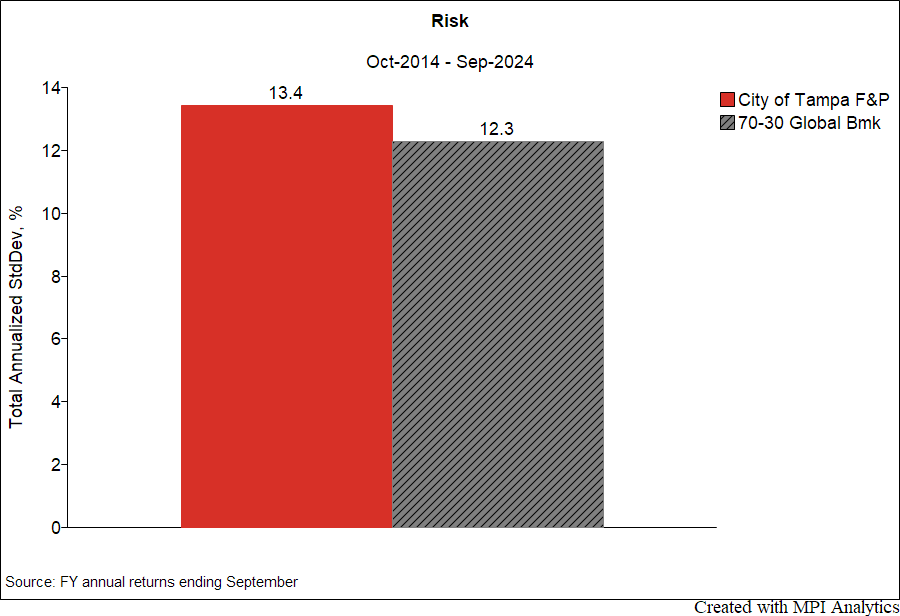
This tech tilt did increase risk (13.4%) modestly versus the benchmark (12.3%).[2] While Bowen downplays volatility, it remains a useful measure when comparing risk profiles. In this case, his clients’ risk level is consistent with other equity-heavy public pensions in the MPI Transparency Lab universe.
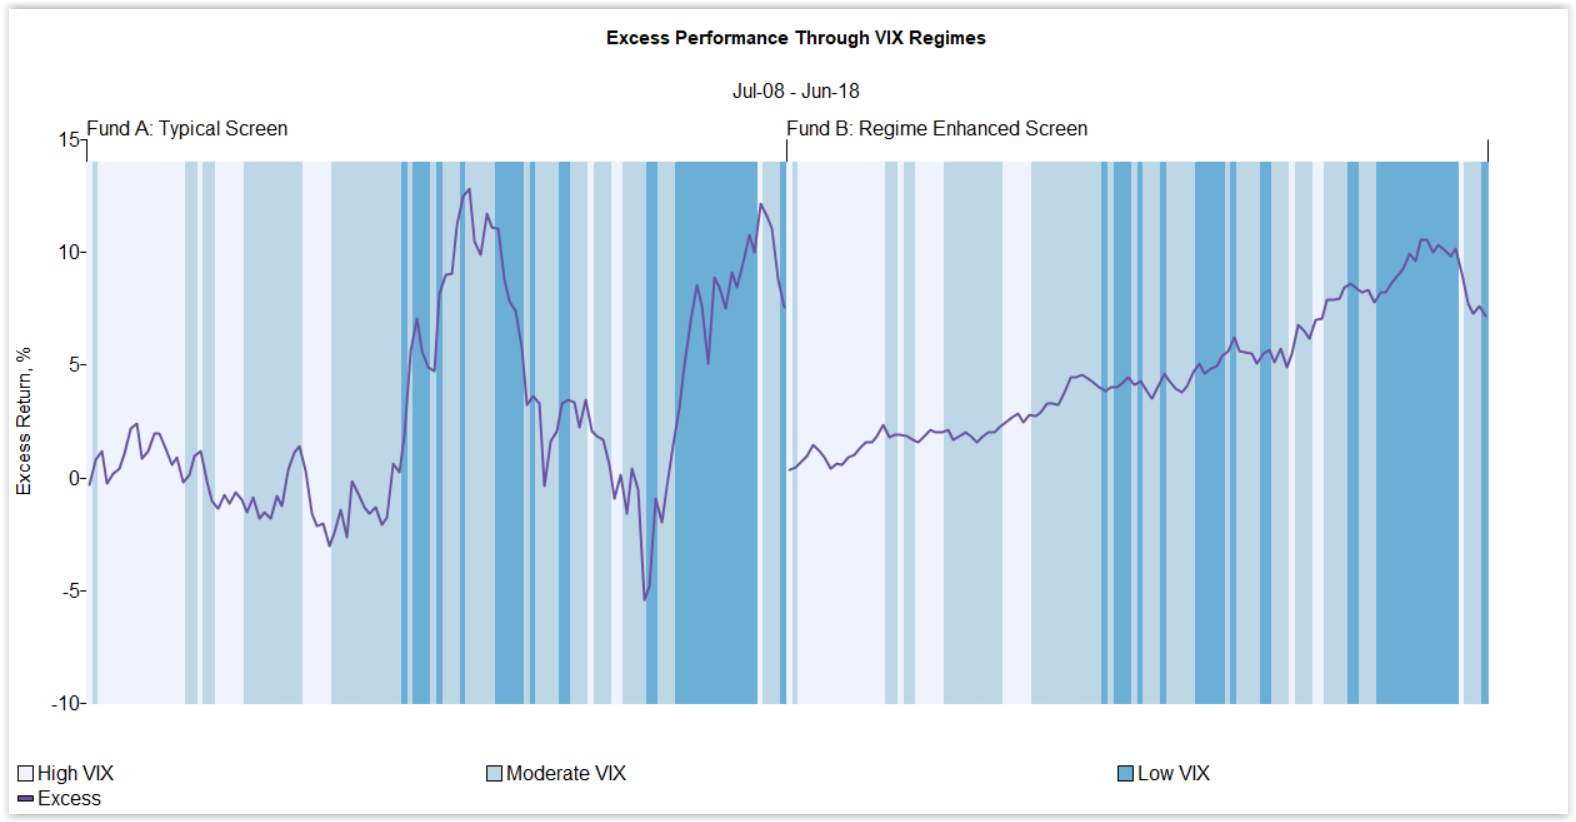
Assess a fund’s potential exposure to complex hypothetical market shocks or historical regimes in MPI Stylus Pro.
However, other plans that are covered in MPI Transparency Lab operate more efficiently. For instance, Nevada PERS, with a Sharpe of 0.78 (as of FY2023), runs a minimalist strategy under CIO Steve Edmundson – without significant staff or complexity. Had Edmundson been a bigger risk-taker, he might have rivaled or surpassed Bowen’s returns.
Fees
According to Bloomberg, Bowen charges his client a flat management fee of 0.25%. In FY2024, this translated into $7 million in fees on a $3.2 billion portfolio – up from $6 million on $2.5 billion in FY2023. Bloomberg compares this to the 0.39% average public pension fee reported by the National Conference on Public Employee Retirement Systems. By comparison, Nevada PERS operates at an even lower cost, with fees of just 0.12% – less than half of Tampa’s rate. The same source cites an average fee of 0.29% for large public pensions, putting Bowen’s fund slightly below average, but still trailing Nevada on operational efficiency.
It’s also important to note that pensions investing heavily in hedge funds and private equity often face significantly higher – and largely undisclosed – fees, which can drag on long-term performance. For example, the Texas Teachers Retirement System paid $1.4 billion in management and performance fees in FY2022 alone, on a $184 billion investment portfolio. These often-hidden costs raise serious questions about the net value of alternative-heavy strategies.
Bowen’s unapologetic stance on risk is, paradoxically, his most transparent trait. He tells trustees he buys “good companies at good prices” and lets dispersion ride, refusing to publish the tracking-error, factor exposures, or even a simple volatility chart. In other words, he is asking to be judged solely on returns, not on the efficiency of the path taken to get there. That at least is honest.
Institutional consultants, by contrast, have spent the last decade steering public plans into private equity that both mask fees and launder volatility through stale appraisals. Our 2023 Ivy League “Volatility Laundering” study showed that a 25% PE allocation can cut reported portfolio sigma (σ) by 15–25% without changing underlying economic risk at all. The result: CIOs look smoother on paper – leaving beneficiaries to shoulder the hidden drawdown exposure. The MPI Transparency Lab lays those numbers side-by-side – the radical openness of the Bowen’s camp about ignoring risk versus the industry’s polished opacity that pretends it doesn’t exist.
We congratulate Jay Bowen and his client on their impressive record – if independently verifiable – and hope they consider greater transparency by posting full return histories online, as many leading pensions do. We also agree with Bowen – and with our colleague Richard Ennis – that the U.S. pension system’s long-standing infatuation with alternative investments has yielded mixed results and deserves serious reevaluation. Our investible index team has spent the past decade exploring practical solutions to this challenge. For further insights, we invite you to read our latest research on the topic.
______________________________
[1] We used a compilation of time-weighted returns for FY2019-24 https://www.tampa.gov/sites/default/files/document/2025/20240930-5yr-history-of-investment-allocations.pdf and dollar-weighted returns for FY2015-18 https://www.tampa.gov/sites/default/files/document/2025/city-of-tampa-p-f-0924-final.pdf p.29. Historical performance and risk data are not posted online; they are available only via a formal public-records request. Although its latest audited financial report discloses current holdings, there is no accessible, verifiable archive of historical performance. Additionally, concerns about governance and opacity were raised as early as 2013 in the article Red Flags Abound at $1.6 Billion City of Tampa Firefighters and Police Pension, and again in the 2015 article The Riddle of Tampa Bay | Chief Investment Officer. According to the Bowen’s firm these two pieces were contested, including subsequent legal action.
[2] We use annual returns to compute standard deviation estimates which tends to underestimate the true volatility when computed with quarterly or monthly observations (unless there’s a significant private equity allocation – then the effect is opposite).
Technology Solutions
Trusted by


