Crypto in Your Portfolio: How Much Melatonin Do You Really Need?
Mapping hidden Bitcoin exposure across 1,500+ mutual funds and ETFs using returns-based analysis.
The last couple of months have been challenging for crypto investors. Since early October’s high, BTC has seen multiple 20–30%+ swings, several $500M–$2B liquidation days, and entire months of ETF inflows effectively erased.
On November 21, 2025, BTC slid to around $81K, wiping out roughly $120 billion in total crypto market cap. Nearly $1 billion in leveraged long positions were forcibly closed (“liquidated”) as margin calls hit, with about $952M gone in a single hour – one of the largest hourly spikes of liquidations this year.
If you’re a long-time crypto investor, you already know this is part of the game. But what if you don’t own BTC directly and instead hold mutual funds and ETFs? How do you know what kind of ride you’re really signed up for – and how much “melatonin” you might need to sleep well at night when Bitcoin moves 20–30% in a day??
That’s where returns-based analysis becomes indispensable – because fund NAVs almost never lie. Such analysis doesn’t use position information but rather funds’ reported NAVs (daily in our case – because a single day could make a huge difference).
What is “returns-based” Bitcoin exposure?
Returns-based BTC exposure is an estimate of how much a fund behaves like Bitcoin, inferred from the fund’s own return history rather than its disclosed holdings. In plain terms, we ask: when BTC moves, does this fund’s NAV tend to move with it — and by how much? This approach can reveal indirect crypto exposure (via “proxy” stocks like exchanges, miners, or corporate BTC holders) even when a fund never reports owning Bitcoin itself.
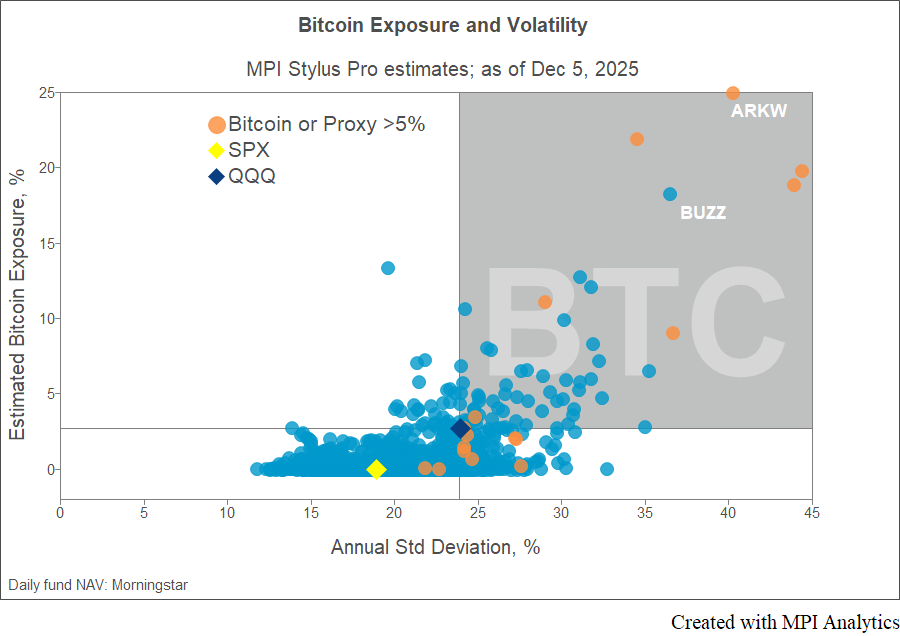
In our “melatonin” diagram, the Y-axis shows the latest BTC exposure estimates for 1,500+ U.S. equity mutual funds and ETFs, computed in MPI Stylus Pro using daily fund NAVs from Morningstar. The X-axis shows annualized standard deviation over the trailing 250 days. We exclude all funds in the “Digital Assets” category because their exposure is obvious and usually close to 100%.
Sign in or register to get full access to all MPI research, comment on posts and read other community member commentary.
Technology Solutions
Trusted by


