Is It Really Alpha? The Missing Factor Behind 2026’s Top Growth Funds
We look beneath the apparent alpha of the top-performing Large Growth funds to ask what may really be driving the returns, and what that could mean for portfolio risk.
The Outperformance Puzzle
Through the first seven months of 2026, something unusual happened in the large-growth mutual fund universe. The Russell 1000 Growth Index returned just 0.3%, while the ten best-performing actively managed Large Growth funds in our Morningstar universe produced returns ranging from approximately 13% to 22%. An equally weighted portfolio of those ten funds returned 18%.
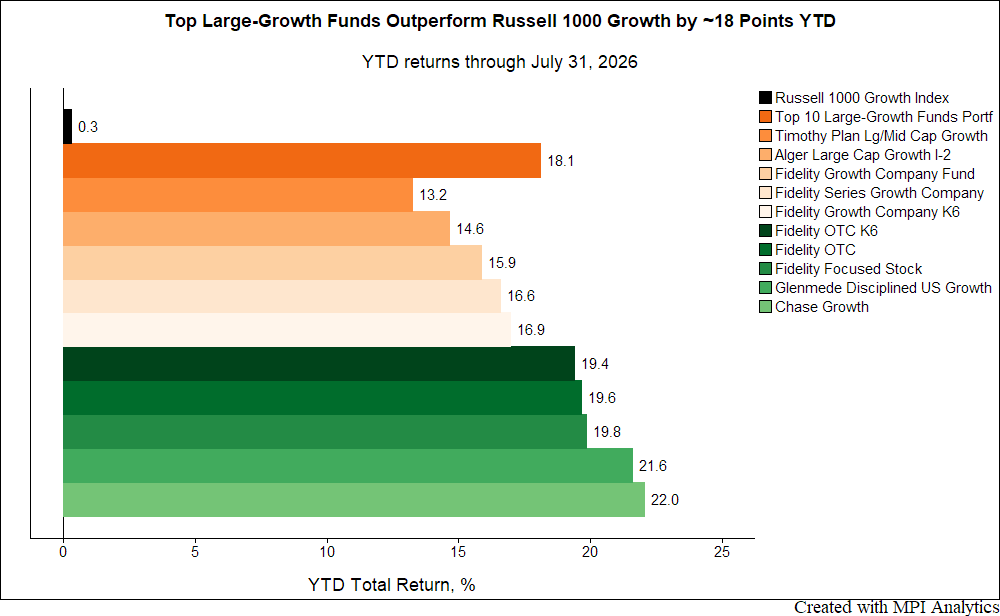
A performance gap of that magnitude immediately raises a question: what were these managers doing differently?
There is a fairly mundane explanation that has to be ruled out first. Style classifications are imperfect, and in a year like 2026 they can matter enormously. Value has significantly outperformed growth, and a recent Wall Street Journal article highlighted just how strange the results can become when stocks migrate between growth and value indices or when supposedly comparable benchmarks use different classification and rebalancing methodologies. A manager classified as Large Growth can therefore appear to generate extraordinary relative performance simply because the portfolio no longer resembles the benchmark very closely.
That possibility seemed particularly relevant here. If the best-performing growth managers had simply moved toward value stocks, much of the apparent outperformance might be an artifact of classification rather than anything more interesting.
We tested that explanation using MPI Stylus Pro and the six Russell size and style indices. For five representative funds — one Fidelity fund, given Fidelity’s large representation among the Top 10, and the four other fund families in the group — the answer was quite clear. The portfolios remained firmly on the growth side of the style spectrum. They did appear somewhat smaller-cap than the Russell 1000 Growth Index, but there was little evidence that a shift toward value was responsible for their remarkable performance.
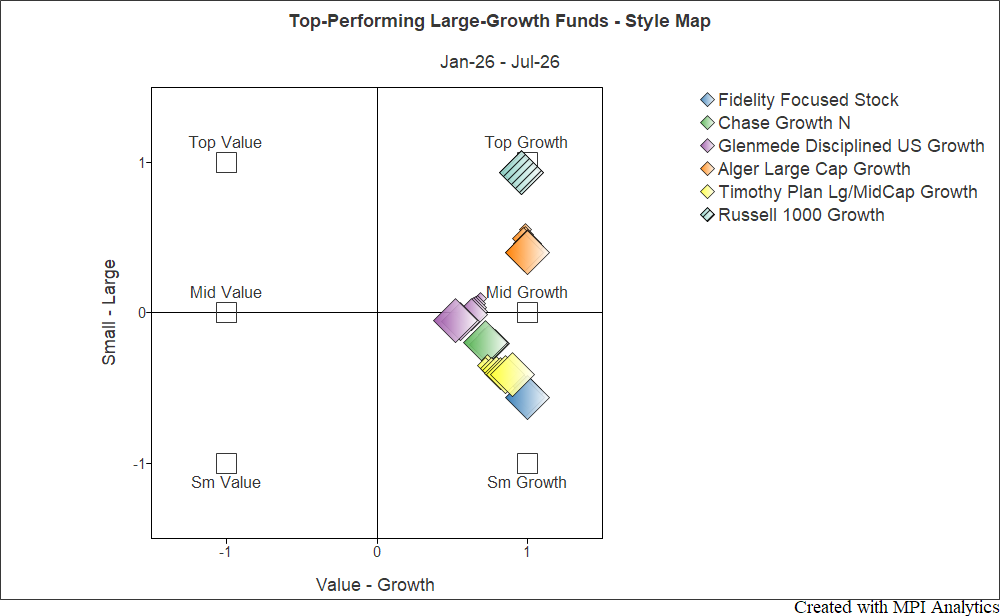
That result created a more interesting problem.
What the Style Model Leaves Unexplained
When we decomposed each fund’s 2026 return into the portion explained by its estimated style exposures and the remaining selection return, the conventional style model left a surprisingly large part of performance unexplained. Across the five funds, the unexplained portion ranged from 4.8 to 13.0 percentage points. For three of them, more than half of the 2026 return was left in the residual.
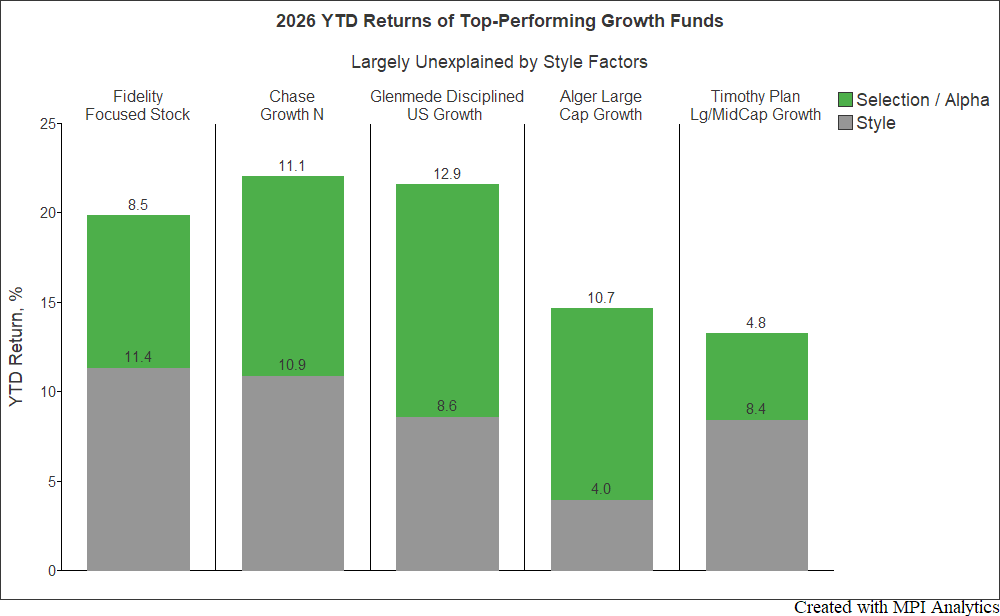
This is often where manager analysis stops.
The benchmark has been beaten, conventional factors cannot explain the difference, and the residual is labeled “alpha,” “selection” or manager skill. That interpretation can be perfectly valid. A talented manager should, after all, produce returns that cannot simply be replicated with broad market exposures.
But there is another possibility that is especially important when several managers are exhibiting the same pattern at the same time. The magnitude of these residuals is notable in its own right. It is even more striking given that several of these are very large, established funds. While size certainly does not preclude successful security selection, it makes it harder to assume that such substantial and simultaneous outperformance across multiple managers is simply the result of idiosyncratic stock-picking skill.
Alpha is a residual, not an explanation.
A large residual tells us that the factors in the model did not explain the return. It does not tell us that no systematic exposure exists. If an important factor is absent from the model, the return associated with that factor will naturally be pushed into the residual and can easily be mistaken for manager skill.
That distinction is more than an academic issue. Genuine manager-specific alpha and an omitted factor have very different implications for portfolio risk. Alpha generated independently by several managers may provide valuable diversification. A common factor shared by several managers can do precisely the opposite.
The challenge, of course, is figuring out what the model may be missing.
Traditional style analysis is deliberately broad. It is designed to distinguish growth from value and large companies from small ones. Sector analysis provides another useful dimension. But some of the most important investment themes in today’s market cut across both style and sector boundaries.
Artificial-intelligence infrastructure is a particularly good example. The beneficiaries of AI capital spending can include semiconductor companies, cloud platforms, networking providers, data-center businesses, electrical-equipment manufacturers, power infrastructure companies and other industrial suppliers. There is no single conventional style box — or even a single GICS sector — that neatly captures that economic exposure.
So rather than accepting the large residuals as alpha, we broadened the search.
Finding the Missing Factor
Using the MPI Stylus Theme Selection Engine, we searched across a universe of thematic indices for exposures that could provide significant incremental explanatory power beyond the conventional Russell style factors. The candidate themes included areas such as AI, AI infrastructure, cybersecurity, IoT, health technology and fintech/blockchain.
One factor stood out: AI Infrastructure/Hyperscalers, represented in the analysis by the Morningstar U.S. Digital Infrastructure & Connectivity Index.
When we introduced that factor into the model, the results changed materially.
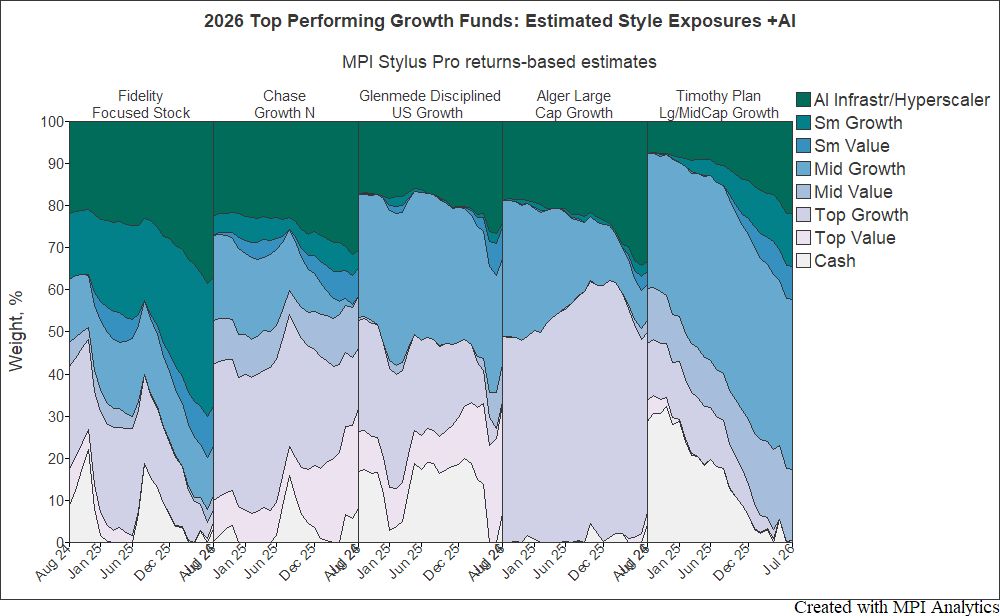
The analysis identified meaningful AI Infrastructure/Hyperscaler exposure across all five funds. At the same time, much of the small-growth exposure estimated by the original style model diminished. In effect, the traditional model had been trying to describe a more specific thematic exposure using the relatively blunt vocabulary available to it.
One important caveat is how these exposures should be interpreted. The estimated AI Infrastructure/Hyperscaler weights represent incremental exposure relative to the conventional style factors already in the model, not the funds’ total exposure to AI-related companies. Because broad growth benchmarks themselves contain significant AI exposure, the estimates should be viewed as an AI-related overweight rather than a measure of total portfolio holdings in the theme.
The most revealing change, however, occurred in the return attribution.
Before introducing the AI factor, the unexplained selection returns for the five managers ranged as high as 13%. After adding it, the residuals fell to between 1.2% and 6.8%. Fidelity Focused Stock’s unexplained return, for example, declined from 8.5% to 1.4%; Chase Growth’s from 11.1% to 2.6%; and Alger Large Cap Growth’s from 10.7% to 3.4%.
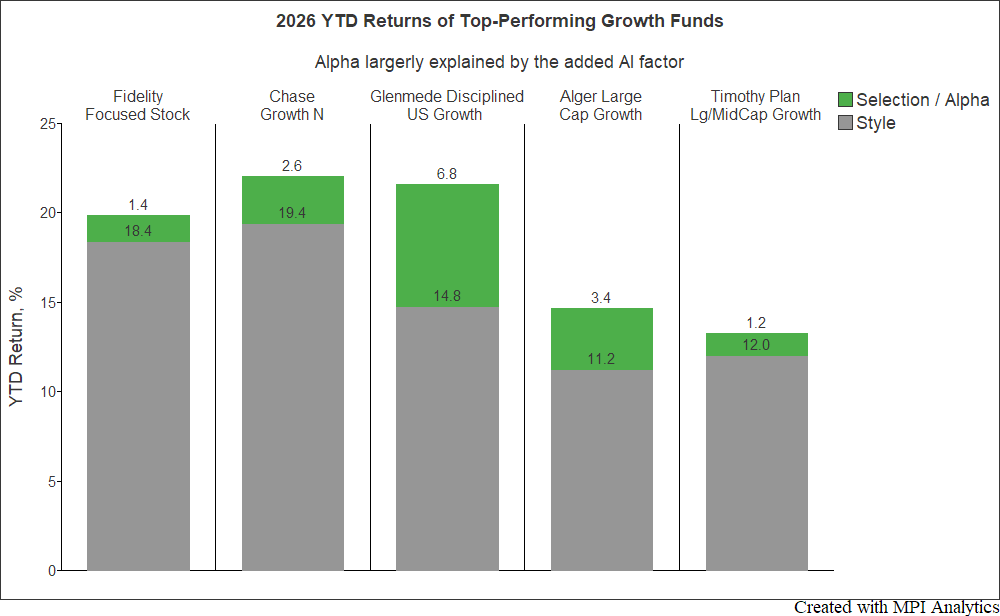
Nothing about the managers changed when we added another factor. What changed was our ability to describe their portfolios.
The analysis does not imply that these managers possess no skill, nor that every percentage point explained by a thematic factor should somehow be deducted from a manager’s accomplishments. Managers still had to identify the securities and exposures that benefited from the theme. What it does show is that a substantial portion of what initially appeared to be manager-specific selection return was associated with a common economic exposure that the conventional style model did not capture.
When Alpha Becomes Portfolio Risk
For fund selectors, that is an important distinction. It is tempting to rank managers by alpha and view a group of high-alpha funds as a particularly attractive collection of independent sources of skill. Yet if the models used to estimate that alpha are missing the same factor, combining several apparently exceptional managers can actually amplify rather than diversify risk.
Consider a portfolio that allocates to several of these top-performing growth managers. Traditional analysis may show different managers, somewhat different style profiles and large positive selection returns for each. The portfolio can therefore appear well diversified and rich in manager alpha. But if several of those residual returns are ultimately being driven by the same AI Infrastructure/Hyperscaler exposure, the allocator may be adding the same underlying bet repeatedly without realizing it.
The concentration may also extend well beyond public-equity managers. A theme such as AI can cut across public equities, private equity and venture capital, hedge funds, private credit, infrastructure and other alternatives. An allocator looking at each sleeve independently may therefore underestimate the portfolio’s aggregate exposure to the same underlying economic factor.
What appears diversified by manager, asset class or investment structure may still be concentrated in the same theme. As long as the theme continues to perform, that hidden concentration looks like a portfolio of successful managers. If the factor reverses, those supposedly independent sources of alpha may reverse together.
This is why unusually high unexplained returns deserve investigation rather than celebration alone. Markets continually produce new themes and economic exposures that do not fit neatly into existing factor classifications. Returns-based analysis can help identify when the old factor map is no longer sufficient — and thematic factor selection can provide a way to search systematically for what is missing.
The question for an allocator, therefore, should not end with “How much alpha did the manager generate?”
It should also include: “What could be hiding inside that alpha — and how much of it do I already own elsewhere?”
Disclaimer:
Some statistics on this page are based on exposure estimates obtained through quantitative analysis and, beyond any public information, MPI does not claim to know or insinuate what the actual strategy, positions or holdings of the funds are, nor are we commenting on the quality or merits of the strategies. Deviations between our analysis and the actual holdings and/or management decisions made by funds are expected and inherent in any quantitative analysis. MPI makes no warranties or guarantees as to the accuracy of this statistical analysis, nor does it take any responsibility for investment or any other decisions made by any parties based on this analysis.
Related Research
- Crypto in Your Portfolio: How Much Melatonin Do You Really Need?
- How Bad is The Negative Alpha?
- Alpha and Excess Return: Not Synonymous
- Bridgewater Pure Alpha: How Much is Explained by Dynamic Beta?
Technology Solutions
Trusted by