Markov Processes International

Quant Funds in the Coronavirus Market Rout: Risk Parity

It’s not as bad as you think (2020 Q1)

Over many of the drawdowns in the latter half of history’s longest ever bull market, risk parity strategies have been blamed time and again for exacerbating selling and volatility. The current bear market rout caused by real and expected economic impacts of the coronavirus pandemic has been no different. Others think the strategy is outdated. Due to the decades-long descent of interest rates to their historic lows some, including Morgan Stanley, have predicted that the strategy is no longer viable and will underperform during the next decade.

But, how have risk parity funds actually acted (or reacted) during the current crisis? Certain funds have done a lot better than naysayers thought – which may be a surprise to some allocators and asset management industry watchers – and a pleasant one to risk parity investors.

Risk parity is a multi-asset strategy designed to perform relatively well in all investing climates by balancing risk across its components. Generally, portfolio volatility is targeted at 10-15% and the bond allocation, due to the historically lower realized volatility in fixed income, is typically leveraged. Allocation shifts are subject to some blend of rules/models and discretionary management, and they are often made gradually. Yet, within those broad confines lies a lot of variance in implementation by managers, often leading to different results.

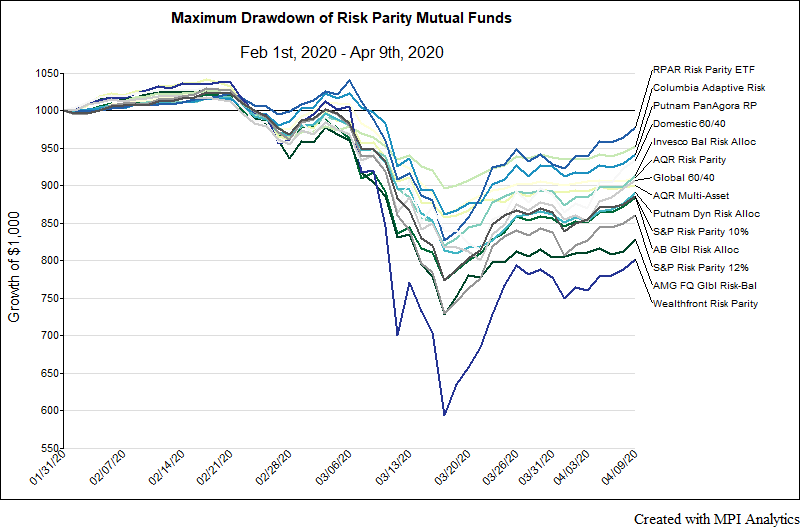
With an estimated total asset base across all risk parity investment vehicles between $175B-$400B, the bulk of assets are in hedge funds, not 40 Act mutual funds. With about $60B, the Bridgewater All Weather funds, from the pioneer of the strategy Ray Dalio and his team at Bridgewater Associates, LP, are the largest in the risk parity universe. The advantage of examining risk parity mutual funds is that they offer us frequent and timely performance data. Dynamic analysis of mutual funds’ daily NAVs using Dynamic Style Analysis (DSA) in MPI’s Stylus platform presents analysts a unique ability to estimate intra-month allocations, even though information on exposures might not ever be available since mutual funds are not required to disclose intra-month positions and only have to report quarterly, doing so with a lag.

Using DSA with daily data, we analyzed a handful of risk parity mutual funds to detect recent allocation shifts. Doing so can give us an indication of the range of expectations for more opaque risk parity hedge fund vehicles before March numbers surface. We also compare these funds to two passive and two systematic benchmark indices: a domestic 60/40 portfolio, a global 60/40 portfolio, the S&P 10% Risk Parity Index and the S&P 12% Risk Parity indices.

Risk Parity funds’ performance as of April 9, 2020. Fund monthly returns: Morningstar.

First, let’s look at losses in terms of max drawdown.  All four benchmark portfolios had a max drawdown between slightly better than -20% and slightly worse than -29%. The risk parity mutual funds lost between -13.4% (Columbia Adaptive Risk CRAAX) and -42.8% (Wealthfront Risk Parity WFRPX).  Despite that wide range, on average, the mutual funds’ losses of -22.2% were similar to benchmarks for the balanced portfolios and better than the selected risk parity strategy indices.  AQR Risk Parity and Multi-Asset as well as Putnam PanAgora also had notably smaller drawdowns than any of the benchmarks.

Next, let’s look at leverage/deleveraging as estimated in MPI Stylus since the start of 20201. Implied leverage of the funds fell, on average, from about 80% to under 30% between the start of January and the week ending April 9th .  The chart below shows the weekly performance of the S&P 500 with the weekly averaged implied leverage level of the risk parity mutual funds.

Could forced selling of assets within risk parity strategies due to the rapid increase in volatility have contributed to a lower market bottom and higher volatility? If the upper end of the estimated asset base ($400B) was similarly levered, and if hedge funds and other risk allocation strategies behaved like the mutual funds2, this does represent a significant deleveraging during a period of intense market stress that extended to the most liquid and traditionally safe assets. It’s certainly possible that risk parity funds were a contributing factor, and possibly a significant one, to the drawdowns, correlation breakdowns and volatility witnessed in March.

Whether there are too few dollars in these strategies to pose a real systemic risk, the effect was offset by allocation funds rebalancing in the opposite direction, Federal Reserve intervention – or some other reason entirely, dire predictions have so far failed to play out.

What about the outliers? Some funds experienced significantly lower drawdowns than any of the benchmarks. Columbia Adaptive Risk’s performance3 implies that it began to de-lever quite early on, although its leverage appeared moderate to begin with. Wealthfront Risk Parity appears not to have de-leveraged at all, while the AQR Risk Parity fund appears to have behaved closer to the mutual fund averages and risk parity indices. When viewed alongside VIX levels in the chart below it makes it easier to decipher each fund’s deleveraging approach. We also note that separate from leverage, we see risk reduction in the form of falling relative equity exposures for all three funds. While these do not represent holdings, the exposures are a close approximation through the use of our dynamic model using a common basket of market indices.

The apparent successful early deleveraging of some funds demonstrates a potential advantage of risk allocation strategies when compared to more traditional dollar balanced strategies.  The apparent lack of timely deleveraging in others allows us to ask some relevant questions.

Risk Parity: a solid approach as long as you know what’s under the hood

The fundamental premise of risk parity is that the volatility of most balanced portfolios, such as a 60/40 blend, is driven mostly by equities.  A risk parity approach allocates risk between major asset classes, economic regimes, or other risk environments as opposed to dollars.  The theory is that this will produce a better-balanced portfolio that should do well in most environments. Correctly measuring, estimating and actively managing risk is key for risk parity to keep the volatility of each asset constant and to maintain an overall portfolio risk target.

As in traditional asset allocation, risk parity relies on low correlation between assets.  When all asset classes fall in tandem, as we saw in the ‘dash for cash’ at the height of the recent market sell-off, high leverage increases the cost of the strategy and a loss of liquidity can exacerbate this. A lot depends on recognizing or better yet, anticipating, a shift in risky assets and continued liquidity, allowing funds to de-lever at an optimal time. Our small set of mutual funds suggest that, liquidity, while extremely stressed, did not evaporate fully this time around, and that some risk parity funds may be quite good at forward expectations. And this could very much matter in the near-term given the very significant risks that exist.

Investor outcomes in risk parity mutual funds have varied, however, and actively monitoring risk parity managers in times of intense stress is crucial, as risk estimations, rebalancing algorithms, investment instruments and even risk targets vary between funds. Dynamic modeling coupled with high frequency fund data is not only helping to monitor funds as they de-lever in “real time” but it also provides a common denominator framework for comparison and due diligence of different risk parity offerings.

We will keep an eye on hedge fund risk parity vehicles’ returns as well, to see how their models and processes will continue to adjust to coronavirus-induced market turbulence.

Lastly, investors have a right to scrutinize whether their risk parity manager’s performance was meaningfully better than an inexpensive balanced portfolio or a lower-cost risk parity strategy delivered in an ETF. With the financing of massive global fiscal stimulus that could lead yields to reverse the downward trajectory that risk parity strategies and their investors have enjoyed since the inception of All Weather in 1996, they should also ask what can be expected from the strategy going forward, given both the current historically low rate environment as well as the potential for yield trends and correlation norms to change.

Updated 4:42pm EST 4/22/2020

Footnotes

Exit mobile version