Smart Beta Rate Sensitivity: How Fed Rate Decisions Could Impact One of the Fastest Growing Fund Segments
Investors have a tendency to downplay interest rate sensitivity as a factor influencing equity products, with the assumption being that its effect must be negligible at most. One of a handful of exceptions to that assumption, however, is concern over the rate sensitivity of low volatility “smart beta” funds.
Investors have a tendency to downplay interest rate sensitivity as a factor influencing equity products, with the assumption being that its effect must be negligible at most.
One of a handful of exceptions to that assumption, however, is concern over the rate sensitivity of low volatility “smart beta” funds. We mentioned this in a previous post and predictions and concerns of underperformance in a rising rate environment have been cited in several industry publications, including Pensions & Investments and ETF.com.
Steady recent increases in the Federal Funds Rate prompted us to conduct an analysis of some common quantitatively managed “strategic beta” strategy ETFs. Our goal is to identify their recent1 sensitivities to changes in the headline 10-Year Treasury Constant Maturity rate.
Estimated using MPI’s proprietary Dynamic Style Analysis2, the following table presents both the average and range of exposures3 across funds to changes in the 10-year Treasury yield for each of five common strategies4.
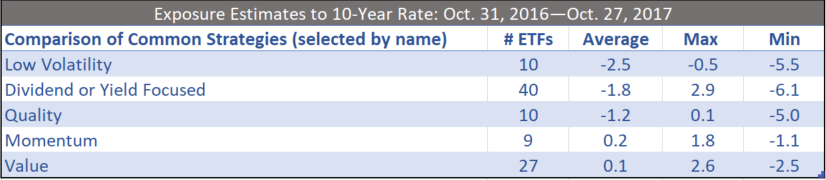
These betas can be interpreted similarly to how bond duration is interpreted. That is, all else being equal, a beta of -5 indicates that a 100-basis point increase in 10-year yields results in a fund return of -5%. Put another way, such a product would have approximately the same duration as a five-year, zero-coupon bond. The difference, of course, lies in the fact that all else is never equal. And unlike with bonds, a number of other factors (broad market, size, sector, style, etc.) are important drivers of their returns.
That’s not to say that rate sensitivities are unimportant for equities. In fact, low volatility ETFs, in particular, tend to show a meaningful and consistent sensitivity to rising rates. The chart below displays the interest rate exposure estimate for each ETF within this group. We also show a Russell 1000 ETF for comparison.
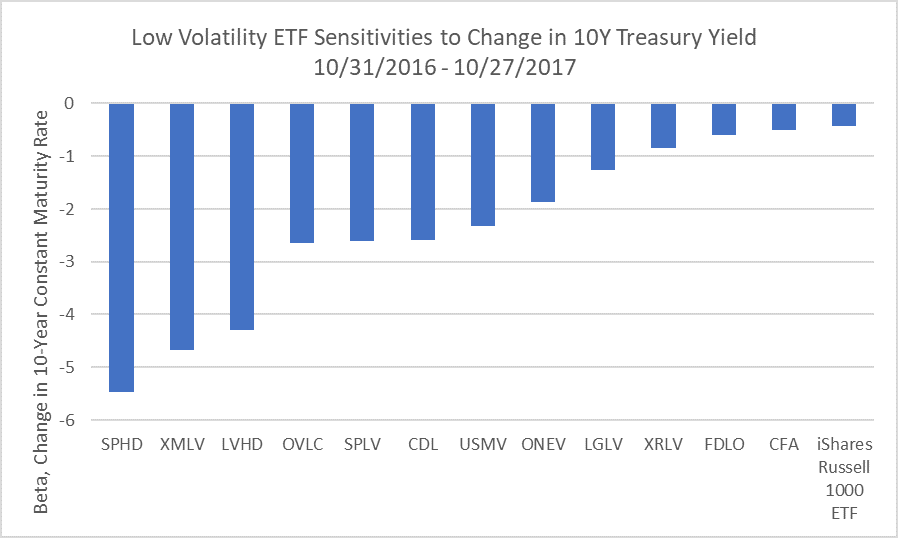
The range in magnitude is somewhat surprising, and it has real implications for investors. In the latter half of 2016, the 10-year Treasury yield saw a run-up of 123 basis points between July 8 and December 15, from trough to peak. However, simply showing low volatility ETFs’ (under)performance for this period could be misleading, given the other factor exposures involved.
Sign in or register to get full access to all MPI research, comment on posts and read other community member commentary.
Trusted by


