Crypto in Your Portfolio: How Much Melatonin Do You Really Need?
Mapping hidden Bitcoin exposure across 1,500+ mutual funds and ETFs using returns-based analysis.
The last couple of months have been challenging for crypto investors. Since early October’s high, BTC has seen multiple 20–30%+ swings, several $500M–$2B liquidation days, and entire months of ETF inflows effectively erased.
On November 21, 2025, BTC slid to around $81K, wiping out roughly $120 billion in total crypto market cap. Nearly $1 billion in leveraged long positions were forcibly closed (“liquidated”) as margin calls hit, with about $952M gone in a single hour – one of the largest hourly spikes of liquidations this year.
If you’re a long-time crypto investor, you already know this is part of the game. But what if you don’t own BTC directly and instead hold mutual funds and ETFs? How do you know what kind of ride you’re really signed up for – and how much “melatonin” you might need to sleep well at night when Bitcoin moves 20–30% in a day??
That’s where returns-based analysis becomes indispensable – because fund NAVs almost never lie. Such analysis doesn’t use position information but rather funds’ reported NAVs (daily in our case – because a single day could make a huge difference).
What is “returns-based” Bitcoin exposure?
Returns-based BTC exposure is an estimate of how much a fund behaves like Bitcoin, inferred from the fund’s own return history rather than its disclosed holdings. In plain terms, we ask: when BTC moves, does this fund’s NAV tend to move with it — and by how much? This approach can reveal indirect crypto exposure (via “proxy” stocks like exchanges, miners, or corporate BTC holders) even when a fund never reports owning Bitcoin itself.
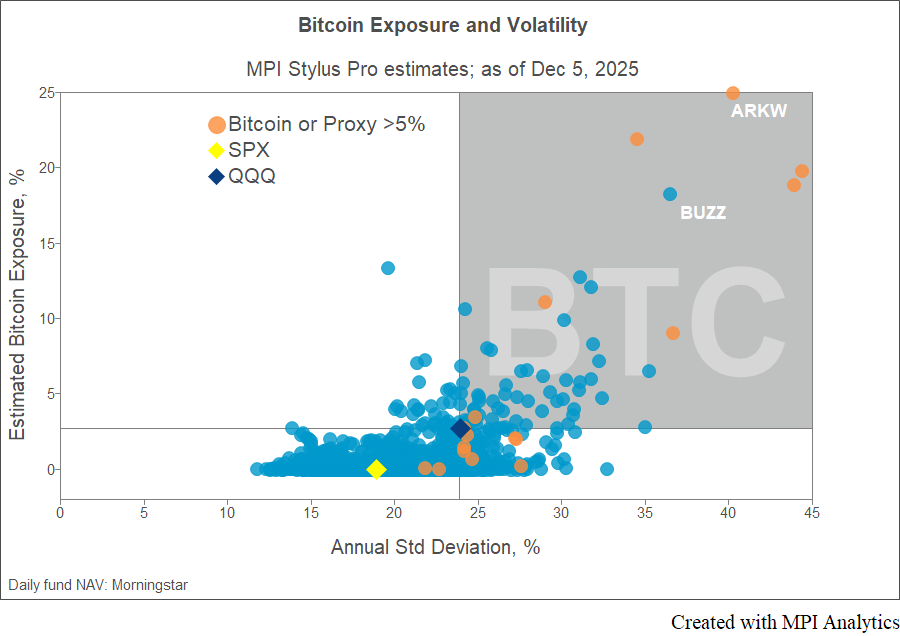
In our “melatonin” diagram, the Y-axis shows the latest BTC exposure estimates for 1,500+ U.S. equity mutual funds and ETFs, computed in MPI Stylus Pro using daily fund NAVs from Morningstar. The X-axis shows annualized standard deviation over the trailing 250 days. We exclude all funds in the “Digital Assets” category because their exposure is obvious and usually close to 100%.
On top of that, we mark in orange all funds and ETFs where exposure to BTC and obvious proxy assets – like Strategy (MSTR) – is already well known and significant. However, BTC exposure can also be indirect and not easily apparent. It might be there without you knowing for months, until holdings reports finally show up. Some funds may hold these stocks intra-quarter and sell out before the reporting deadline. For that reason, a returns-based approach is often the only practical way to keep track of evolving exposure in near real time.
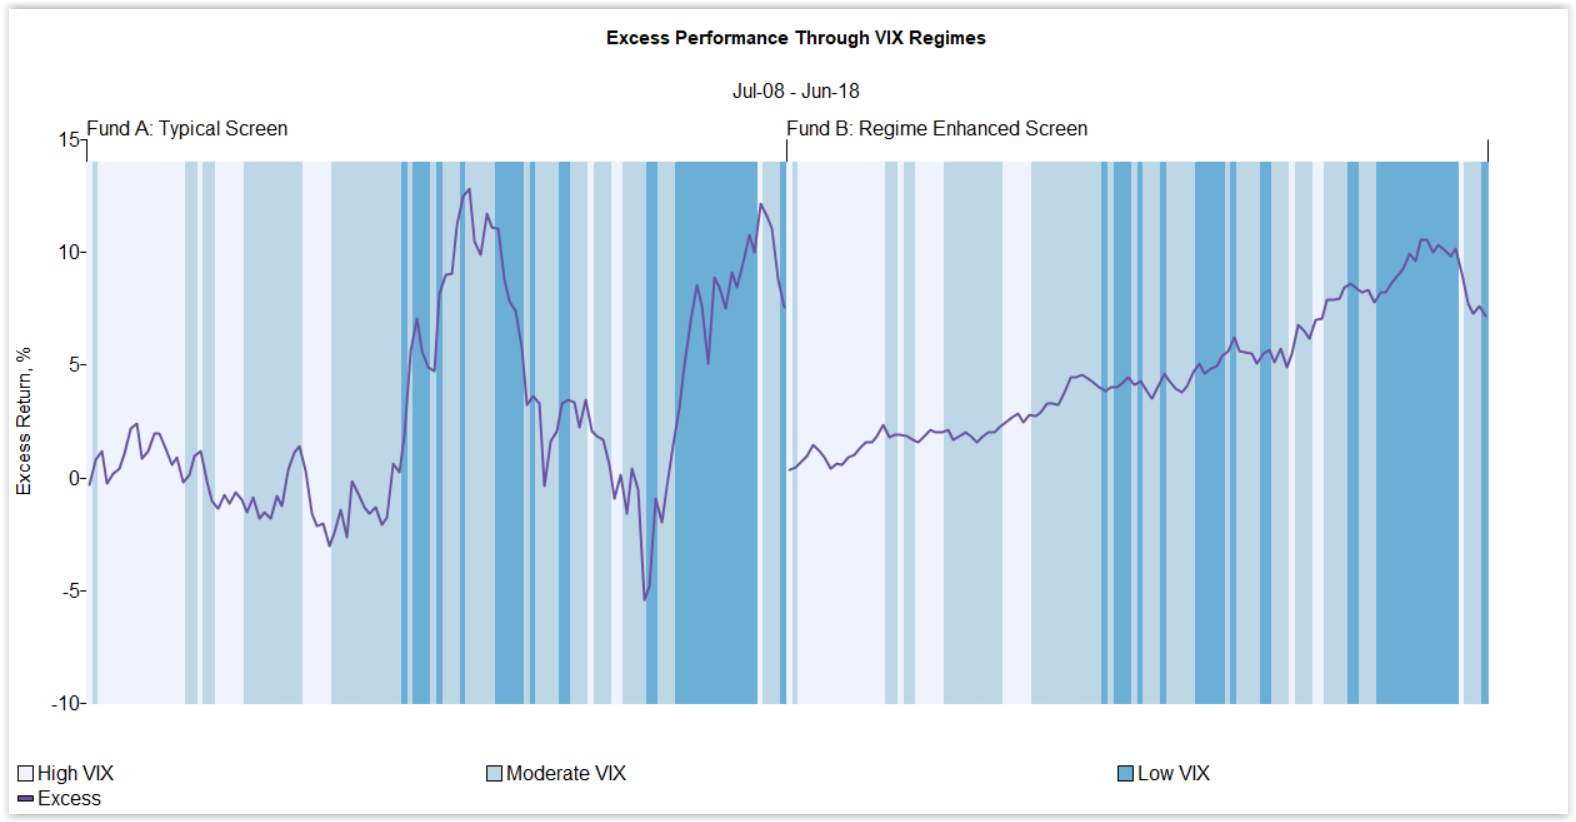
Assess a fund’s potential exposure to complex hypothetical market shocks or historical regimes in MPI Stylus Pro.
Why QQQ shows BTC exposure (even with no BTC mandate)
We use Invesco’s QQQ ETF as a reference point (for both volatility and “baseline” BTC exposure). QQQ holds the stocks in the Nasdaq-100 Index, an equity index of 100 large non-financial Nasdaq-listed companies. It’s designed to hold stocks only: no commodities, no spot BTC, no BTC futures. Yet our Stylus analysis indicates that QQQ still picks up a few percent of effective BTC exposure via constituents that either hold BTC on their balance sheets or are tightly linked to the crypto ecosystem. (QQQ currently holds MSTR – MicroStrategy / “Strategy”: Added to the Nasdaq-100 effective Dec 23, 2024 – at about 0.24% weight. Tesla (TSLA) – Tesla holds ~11.5k BTC on its balance sheet. TSLA is a top-10 QQQ holding with ~3–4% weight).
We focus on the north-east quadrant from QQQ – funds and ETFs with both higher BTC exposure and higher volatility than QQQ. Interestingly, within that quadrant we observe an almost linear relationship between the two: total volatility is closely related to BTC exposure (with a single outlier). For funds/ETFs with known BTC exposure (marked in orange), this is no surprise. But for many others, that exposure is far from obvious and would require a lot of homework – or even daily monitoring – to uncover by holdings alone.
Case studies
BUZZ — high indirect BTC exposure
Take, for example, VanEck’s BUZZ ETF, which tracks the BUZZ NextGen AI US Sentiment Leaders Index — 75 U.S. stocks with the strongest positive social-media and online sentiment. BUZZ doesn’t own BTC directly – no spot BTC, no futures in the index rules – but because of how the index is constructed, it keeps getting stuffed with “Bitcoin proxy” stocks.
In our melatonin diagram (data through December 5, 2025), BUZZ shows one of the highest indirect BTC exposures at ~18.5%, with annualized volatility of ~36% – roughly 50% higher than QQQ.
ARKW — more direct BTC exposure
ARKW ETF, on the other hand, has much more direct Bitcoin exposure than QQQ or even BUZZ, for two reasons:
- It explicitly allocates to BTC via a Bitcoin ETF position (about 5–6%), and
- It layers in a substantial sleeve of crypto-linked stocks:
- Coinbase (COIN) – ~5% weight
- Robinhood (HOOD) – ~5%
- Circle Internet Group (CRCL) – ~3%
- Tesla (TSLA) – ~10% (small BTC on balance sheet, high correlation to BTC/risk-on sentiment)
Compared to QQQ or even BUZZ, ARKW is intentionally designed to have meaningful Bitcoin and crypto exposure as part of its “Next Gen Internet” theme, not just incidental spillover. It’s therefore no surprise that, in our diagram, ARKW shows the highest BTC exposure in our sample, at roughly 25% by our estimates – captured by MPI Stylus Pro solely from ARKW’s daily prices, without any position data.
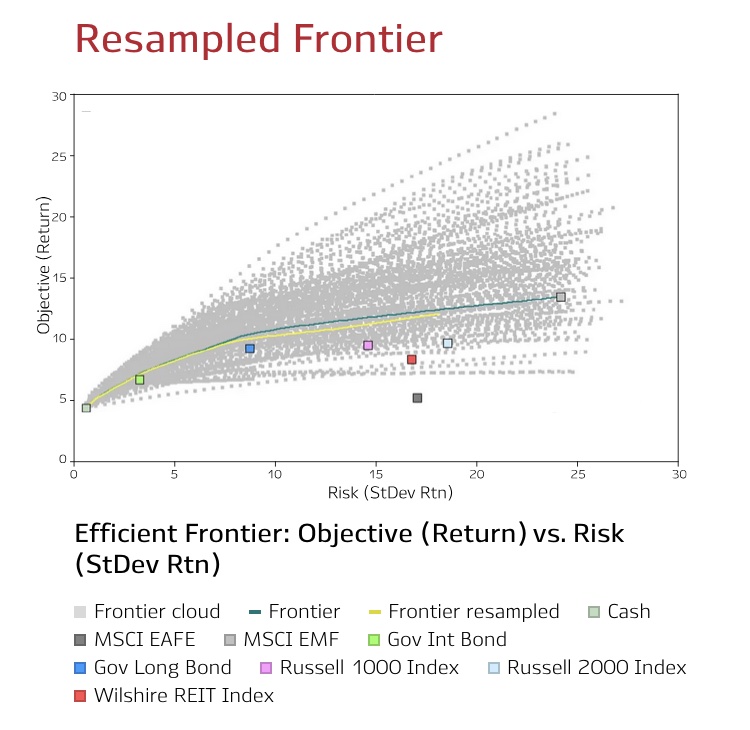
Saves time and money with MPI’s comprehensive software platform that provides both historical and forward-looking analysis capabilities
What this means for advisors / allocators
As expected, the majority of 1,500 funds show no meaningful exposure to BTC in our analysis – no melatonin needed. However, there are dozens of funds (the blue circles) with BTC exposure estimates 2–5x higher than QQQ without any obvious “digital assets” branding or headline holdings. By now we should know that this kind of hidden exposure inevitably leads to a roller-coaster ride whenever BTC takes a dive or launches into another vertical rally.
So next time, before you go to bed with your portfolio, make sure you’ve checked with your “doctor” – a returns-based style and risk analysis (the kind our clients run in MPI Stylus every day) – or at least your risk team – to see how much BTC “melatonin” you really need.
Methodology: How we estimated BTC exposure
- Universe. 1,500+ U.S. and global equity mutual funds and ETFs with at least 250 trading days of daily NAV history, using Morningstar data. Funds classified as “Digital Assets / Crypto” were excluded.
- Data & horizon. Daily total returns over the trailing 250 trading days ending December 5, 2025.
- Tool. Returns-based style and risk analysis performed in MPI Stylus Pro using Dynamic Style Analysis (DSA) to accurately estimate the latest exposures
- Model. Each fund’s returns were regressed on a factor set that includes broad equity, sector and style factors, plus a Bitcoin factor (based on daily BTC price changes). The “BTC exposure” shown in the chart reflects the estimated sensitivity to that Bitcoin factor.
- Volatility. X-axis volatility is the annualized standard deviation of daily fund returns over the same 250-day window.
- Caveats. Exposures are estimates, based on returns, not position data. Results may differ from manager-reported allocations and are intended for illustrative, not supervisory or compliance, purposes. Exposures are the most recent and may not reflect trailing 250-day volatility.
FAQ
-
Can a fund have Bitcoin exposure without holding Bitcoin?
Yes — exposure can come from proxy stocks (miners, exchanges, treasury holders) and risk-on factor behavior.
-
Why does QQQ show BTC exposure if it doesn’t hold BTC?
Because some constituents are economically linked to crypto (directly or via treasury/earnings sensitivity).
-
How often should an allocator monitor BTC exposure?
If you care about drawdowns, monthly is the minimum; during high-vol regimes, weekly/daily is ideal.
-
Is returns-based exposure “the same” as holdings exposure?
No — it’s an effective exposure estimate from behavior (returns), and it can detect changes faster than quarterly holdings.
References
- Crypto market liquidation spike (Atomic Wallet)
- QQQ holdings / weights (CompaniesMarketCap)
- Tesla BTC treasury (BitcoinTreasuries)
- BUZZ ETF overview (VanEck)
- ARKW holdings overview (StockAnalysis)
Technology Solutions
Trusted by


I like the quality of your graph. Next time you should write a 3 lines of the dynamic stule analysis used.