Measuring The Ivy 2020: First Take
We take a quick look at Ivy schools' endowments' performance results both for the 2020 fiscal year and also long-term for 10-year periods.
Well, it’s that time of the year… All Ivy endowments’ results for the fiscal year (FY2020) that ended June 30, 2020, are in and, while we’re still waiting for the final Q2 numbers for private asset benchmarks to take a deep dive on Ivys’ performance drivers, some important observations can already be made.
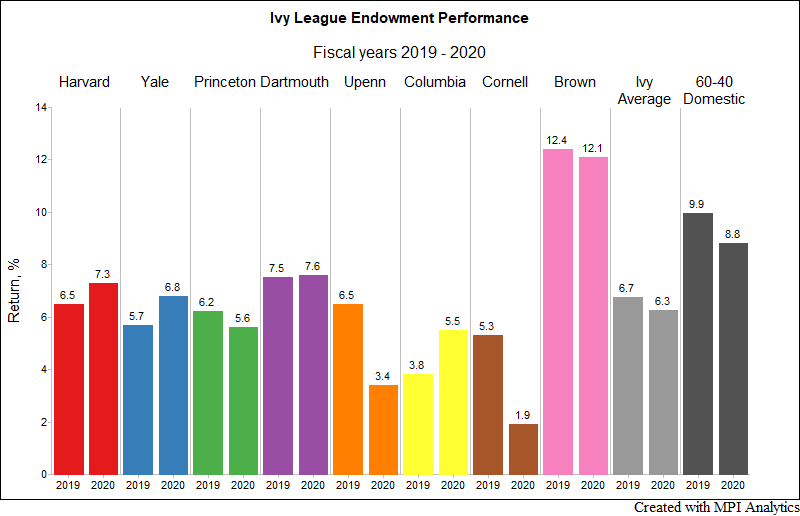
For the second consecutive year, all Ivy endowments (save for Brown) and the Ivy average underperformed a 60-40 portfolio of US domestic stocks and bonds: Ivy average return for FY2020 was 6.3% vs. 8.8% for the 60-40 quarterly rebalanced portfolio of the S&P 500 Index and Bloomberg Barclays US Aggregate Bond Index. This year’s results show significant dispersion among the eight-member Ivy League schools – even wider than last year’s. Brown pulled way ahead of the pack for the second straight year, boasting 12.1%, while the lowest return among Ivies was reported by Cornell, coming in at 1.9%. Ivy endowment results have been fairly consistent for the past two fiscal years with the exception of Penn and Cornell – both exhibiting a significant drop in returns in FY2020 as compared to FY2019.
Sign in or register to get full access to all MPI research, comment on posts and read other community member commentary.
Technology Solutions
Trusted by


