MIT’s Risky Business
Reading the President’s warning through the lens of liquidity vs. market risk
Related research: Elite U.S. Endowments: Government Funding and Liquidity Pressure • A Private Equity Liquidity Squeeze By Any Other Name • Multiple Shades of “Green”: UPenn’s Cash Flow Dilemma • FY2023 Ivy Report Card: Volatility Laundering and the Hangover from Private Markets Investing
Prophecies abound
Media coverage has zeroed in on President Sally Kornbluth’s recent message warning of “significant new financial pressures,” “financial realities,” and – most notably – conveying grave uncertainty: “no one can predict what’s coming at us next.” The immediate question is: what are these pressures, really, and where could the true fragility lie?
What’s already known (and largely manageable)
Over the past year MIT has taken textbook steps to address budget pressure – e.g., a hiring freeze for many non‑faculty roles, targeted expense reductions, and issuing roughly $750 million in taxable debt – these are things that businesses do on a regular basis without a lot of fanfare. On their own, even an incremental $190 million annual hit from an 8% tax on investment income (roughly ~10% of the central budget) shouldn’t upend a ~$24B endowment that has compounded at 10.5% annually over the last decade. Then, there are risks of a different kind – university is embroiled in multiple legal actions with the government while dealing with hate speech, antisemitism and swastikas on campus.
So why the emphasis on unexpected financial pain?
Liquidity ≠ the main problem
MPI is known for its technology that can read “between the lines” – whether these are cash flows of a private fund, NAVs of a star hedge fund, or annual financial results of an endowment. Few years ago, we launched MPI Transparency Lab to leverage MPI Stylus analytics to provide insights (derived from public financial reports) into inner workings of elite institutions. Right after FY23, the Lab warned of a looming liquidity squeeze facing elite endowments and projected that PE‑heavy portfolios would be forced to sell private equity stakes at discounts and raise more debt – well before any threats of government cuts.
From an MPI Transparency Lab perspective, MIT’s liquidity profile screens as comparatively resilient among elite endowments:
- On our Funding vs. Liquidity Risk Map, MIT sits in the lower‑left quadrant: relatively low unfunded PE obligations and relatively modest reliance on federal funding (excluding Lincoln Lab) when both are scaled to readily available liquid assets. In a world where both PE capital calls and budget gaps compete for cash, MIT looks sturdier than most – likely second only to Dartmouth in our current universe.
- MPI Lab estimates place unfunded PE commitments at ~19.5% of total PE allocated & committed, consistent with a mature, distribution‑ready private equity book. Liquidity risk never disappears, but for MIT it does not appear to be the first‑order concern implied by the President’s language.
It’s (largely) market risk
Where MIT truly stands out is portfolio volatility. Using MPI Stylus factor‑based estimates, MIT exhibits a 10‑year annualized standard deviation of 21.6%, nearly double both a 70/30 global benchmark (~11%) and the lowest‑risk peer, Columbia (~11.9%). Brown is the only elite peer in the same neighborhood, at ~20.1% volatility and Duke has similar if not higher risk as MIT but this could be explained by its exposure to volatile crypto (via Coinbase).
Even if one computes volatility directly from annual endowment returns (a blunt method), MIT still screens ~50% more volatile than the benchmark.
“Is that leverage?” Not (primarily) in the accounting sense
MIT’s FY24 financials document the use of derivatives (futures, options, swaps) and leveraged real‑estate structures:
- Average net notional derivatives exposure of about short $0.78B during FY24, with collateral posted at brokers.
- Real‑estate leverage: roughly $1.3B of related liabilities embedded in the investment pool.
Those figures confirm leverage is present – but at magnitudes far smaller than what would explain endowment‑level volatility in the 20%+ range by themselves. The more convincing driver, in our view, is embedded risk within private assets – especially venture capital (VC).
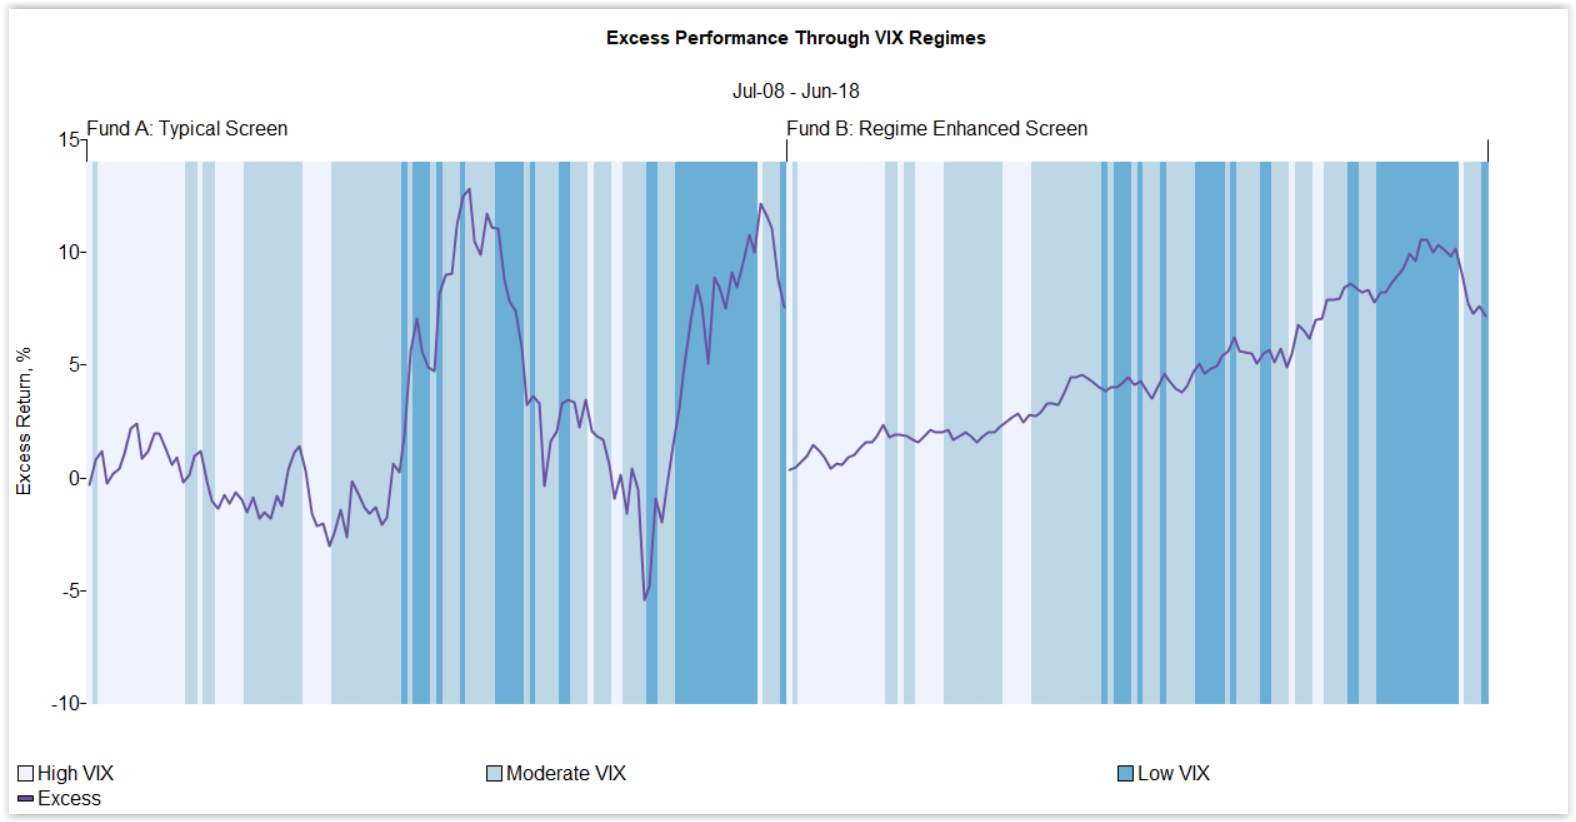
Assess a fund’s potential exposure to complex hypothetical market shocks or historical regimes in MPI Stylus Pro.
How to explore this in MPI Transparency Lab. Once you register to MPI Transparency Lab you will get access to individual endowment reports with risk and return contributions, stress-tests, market regime analysis and hypothetical scenarios – all that information that only few insiders can get. Of course, our numbers are only estimates that we get from annual returns number with the help of our MPI Stylus research platform. Once you open MPI360 MIT report you will notice that by far the biggest contribution of both risk and return is coming from VC investments.
VC vs. PE: book allocations vs. risk exposure
For starters: what is MIT’s VC allocation? MIT does not publish a standalone VC percentage – and only few peers (e.g., Yale, Brown) sometimes separate buyout vs. venture in public materials. The $24.6B endowment is invested through MITIMCo’s unitized long‑term Pool A (with separate short‑term pools for liquidity). As of June 30, 2024, MITIMCo reported $31.7B in total investments across long‑ and short‑term pools. Because MIT does not disclose how much sits in Pool A vs. short‑term pools – and because public tables group venture within private equity, we have to infer.
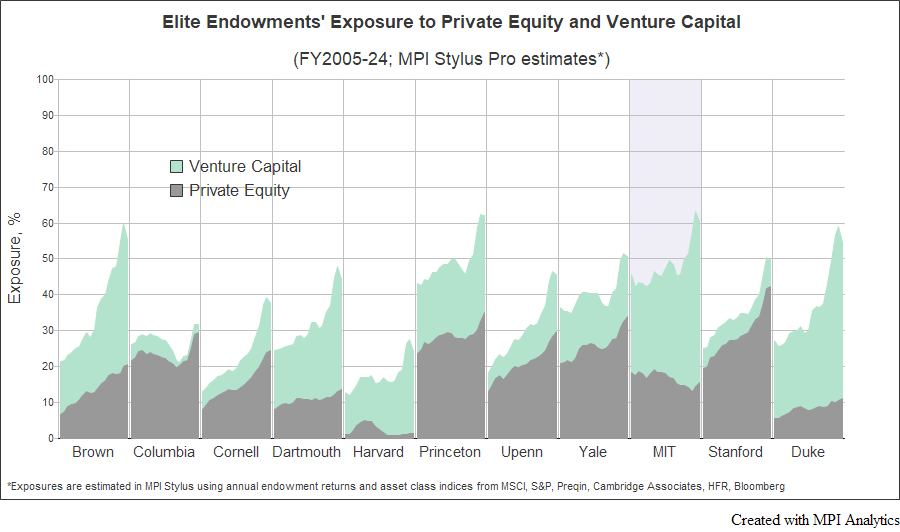
On a book basis, private equity (including VC) was about $11B in FY24. That works out to roughly 35–36% of MITIMCo’s total investments ($11B ÷ $31.7B) or about 46% when measured against the endowment alone ($11B ÷ $24.6B). Given that private equity holdings reside in the long‑term pool, the endowment denominator (~46%) is the more appropriate reference, placing MIT near the top of the Ivy range (comparable to Yale).
But risk‑adjusted exposure tells a sharper story. MPI Stylus analysis below of reported endowment returns implies ~60% effective exposure to private assets – among the highest in the group – with VC contributing disproportionately to both return and risk. Why higher than the book weight? Because the actual investments can carry much higher beta against the Cambridge Associates PE and VC indices used as asset-class proxies. If you were hedging the portfolio, you’d hedge closer to this risk‑adjusted footprint, not the book weight.
VC investments may appear as high-risk and implicitly levered. Academic work (e.g., Korteweg & Sørensen) estimates VC market betas ~2.6–3.0, reflecting embedded optionality and selection dynamics; a beta around 3.0 implies 2X leverage.
Saves time and money with MPI’s comprehensive software platform that provides both historical and forward-looking analysis capabilities
Many elite endowments (MIT among them) may be using VC, intentionally or not, as an under‑the‑radar way to lever equity risk – it lifts long-term returns but also raises volatility and valuation uncertainty.
The “unexpected” Ms. Kornbluth may be bracing for
Yes, FY25 could print strong headline results. But when operating budgets are under real, sustained pressure, leaders have less tolerance for stale private-asset marks, down-rounds, and slow exits. Relative to buyouts – where businesses throw off cash and valuations are anchored in comparables – VC marks can swing quickly, especially if later‑stage growth rounds reset. That asymmetry is the kind of surprise that can make an otherwise manageable $190M budget headwind feel more precarious.
Final words
Early reads suggest the broad VC benchmark could post a double‑digit gain in FY25 after two down years. That’s welcome news, but VC results are all over the map – performance varies hugely by fund, vintage, and deal mix.
In FY2021 MIT’s endowment reported 55.5% return – the highest in our group of ten elite schools. We don’t know how much of that came from VC, but the analysis above indicates it was substantial. In MITIMCo’s March 2022 “15-Year Letter” (covering results through June 30, 2021), venture capital is discussed within their “profit-tomorrow” exposures (incl. biotech).
Speaking of “profit-tomorrow,” only President Kornbluth and the MITIMCo leadership team see the full, position‑level picture of MIT’s specific investments – and what that FY2021 55.5% jump is really worth today. As official reports and community updates arrive in the next several weeks, we’ll learn more about how those details translate into budgets, liquidity, and risk.
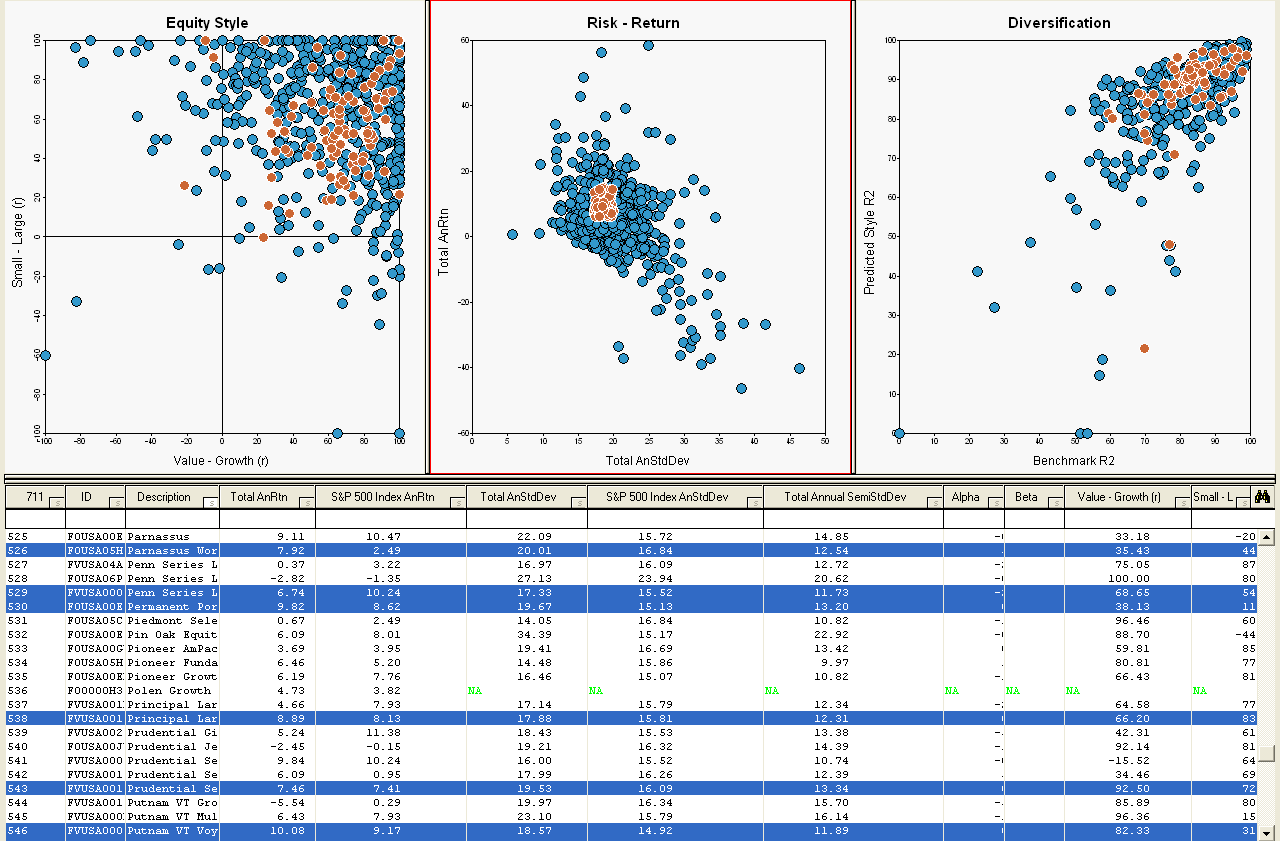
MPI’s powerful visual platform enables users to analyze fund peer groups and universes across an unlimited library of pre-set and custom analytics.
_______________
Technology Solutions
Trusted by


