Western Asset / Leech: What Return-Based Surveillance Could See
Using the Western Asset / Leech case as a study, we show how return-based surveillance can identify exposure drift, selection divergence, and performance deterioration that warrant closer due-diligence review.
Western Asset’s $100 million SEC settlement has put the Ken Leech trade-allocation case back in the spotlight.
The SEC and DOJ allegations focused on a January 2021–October 2023 period in which favorable trades were allegedly allocated to Western Asset’s Macro Opportunities strategy, while unfavorable trades were allegedly allocated to Core and Core Plus strategies — all managed or co-managed by Leech. The case centered heavily on trade allocation, timing, and Treasury-derivatives transactions. Western Asset settled the SEC matter without admitting the SEC’s findings; Leech separately pleaded guilty to obstructing the SEC investigation.
This is not a fraud-detection story. Return-based analysis cannot see trade tickets, allocation timestamps, derivative instruments, or intent.
But it can ask a useful due-diligence question: did the public return behavior of related portfolios show patterns that should have prompted a closer look?
A star fund
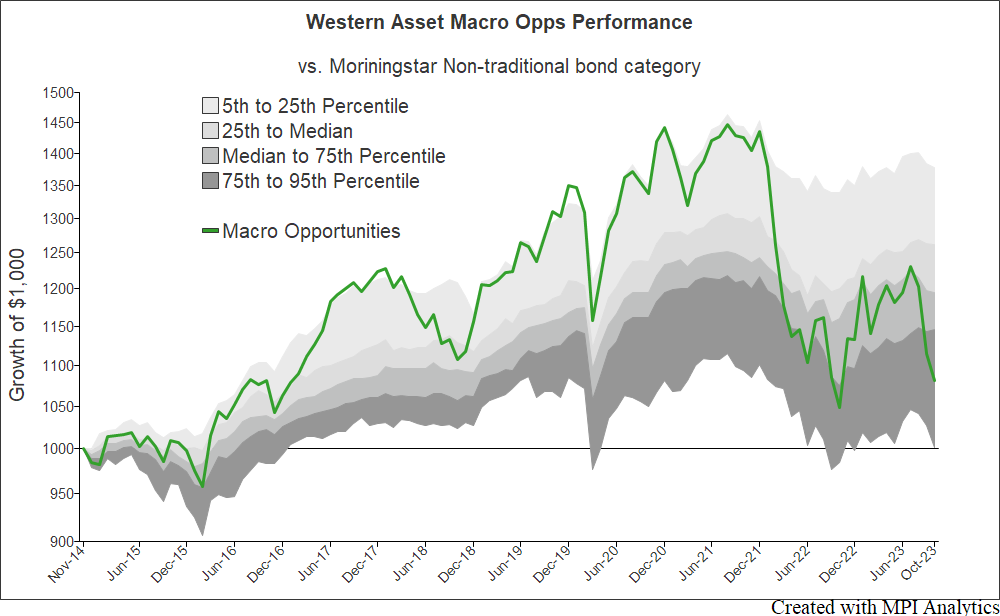
Western Asset Macro Opportunities was not a marginal fund quietly drifting below its peers.
For much of the period shown below, the fund dominated the Morningstar Nontraditional Bond category. A $1,000 investment in LAOIX rose well above the peer-group range, reflecting the kind of performance that can build a star-manager narrative and investor confidence.
Then the pattern changed.
The fund suffered a sharp drawdown around the early-2022 Russia debt shock, partially recovered, and then weakened again into 2023. By the end of the SEC/DOJ period, the same fund that had once stood far above the category had fallen back toward the lower part of the peer distribution. The final decline may also relate to the Credit Suisse debt episode described in the legal record.
That reversal is not, by itself, evidence of misconduct. Strong managers can have bad periods, and flexible bond strategies can behave very differently from category peers. But it does raise the starting question for return-based surveillance:
When a dominant fund run by a senior manager begins to behave very differently — especially when related portfolios under the same investment leadership are also moving in unusual ways — what should allocators, consultants, and risk teams have been able to see?
Exposures: setting the baseline
Nontraditional bond funds are expected to look different from Core and Core Plus bond funds. That is the point of the category.
A nontraditional bond manager may use global sovereign debt, emerging-market debt, high yield, leveraged loans, non-agency mortgages, currency exposure, derivatives, and other flexible tools that are generally not present in large size in a traditional core bond portfolio. Core and Core Plus funds, by contrast, are typically anchored in U.S. government, corporate, mortgage-backed, agency, and related fixed-income exposures.
The category exposure chart below supports that baseline. On average, the overlap between Nontraditional Bond and Core/Core Plus appears modest, concentrated mainly in areas such as high yield and asset-backed exposure.
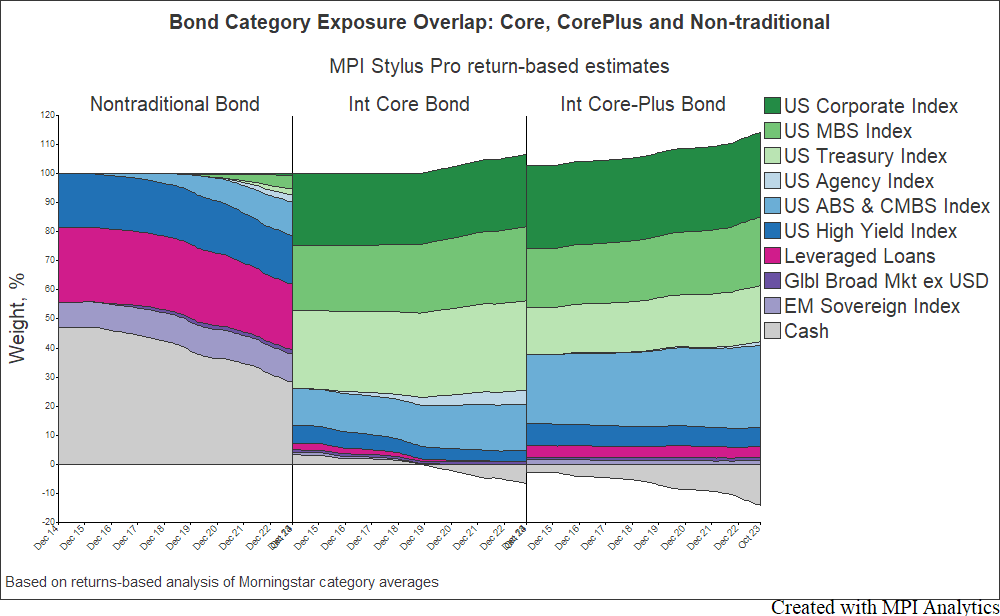
That makes the fund-specific exposure pattern more interesting.
A strategy reversal
A different picture emerges when we look at the three Western Asset funds managed or co-managed by Leech through the lens of monthly returns in MPI Stylus Pro.
The Core Bond and Core Plus Bond funds look broadly consistent with their categories. Their estimated exposures are dominated by traditional U.S. fixed-income factors: government, corporate, mortgage-backed, agency, and related sectors.
Macro Opportunities starts differently. Earlier in the period, its estimated exposures look much more consistent with a broad nontraditional mandate, with meaningful exposure to areas such as emerging-market sovereign debt and leveraged loans.
But over time, a core-bond overlay begins to emerge in Macro Opportunities. Traditional bond exposures — including U.S. corporate, mortgage-backed, agency, and Treasury factors — become increasingly prominent. By 2023, the model suggests that these traditional exposures had become a major part of the fund’s return behavior. In the full model, this shift is accompanied by negative cash, which can be interpreted as implied leverage or overlay-like behavior.
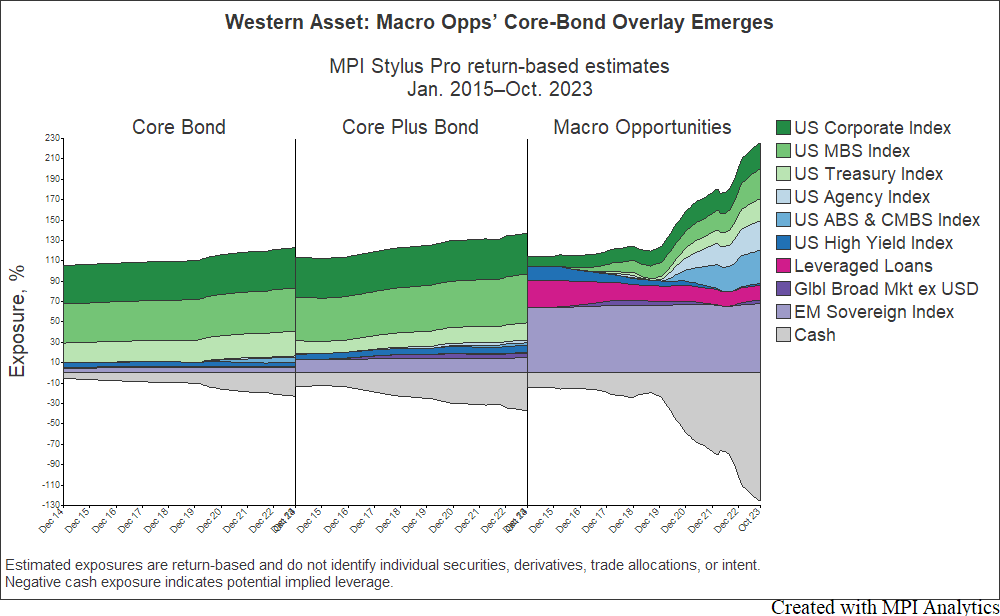
That does not identify individual securities. It does not prove derivative use. It does not prove cherry-picking.
But it does show that Macro Opportunities’ return behavior increasingly overlapped with the more traditional Core and Core Plus opportunity set.
That matters because the SEC complaint describes overlapping asset classes across Macro Opps, Core, and Core Plus, including Treasuries and Treasury derivatives, investment-grade corporate bonds, high yield bonds, and mortgage-backed securities. The complaint also states that investment opportunities suitable for Macro Opps were frequently also suitable for Core or Core Plus.
AUM and scale
The AUM dynamic is important. The alleged allocation pattern would be harder to understand if Macro Opportunities were too small to be affected materially, or if Core/Core Plus were too small to absorb offsetting losses. That was not the case.
According to the SEC complaint, at times during the Jan. 2021–Oct. 2023 “Relevant Period,” Macro Opps had more than $13 billion in AUM, Core had more than $44 billion, and Core Plus had more than $122 billion. As of June 30, 2024, the SEC said those strategies had fallen to approximately $2.1 billion, $31.1 billion, and $66.8 billion, respectively, across multiple portfolios.
In other words, Macro Opps was large enough for trade allocation to have a meaningful performance impact, while Core and Core Plus were much larger pools across which unfavorable outcomes could be more widely dispersed.
Again, this does not prove the allegations. But it helps explain why cross-portfolio monitoring of the three strategies would have been relevant.
From factor model to performance flags
MPI’s dynamic factor model allows us to estimate the portion of fund returns not explained by modeled market exposures — what we refer to here as estimated security selection contribution.
This is return-based residual performance. It does not identify actual securities, individual trades, allocation timing, or intent.
Still, the pattern is striking.
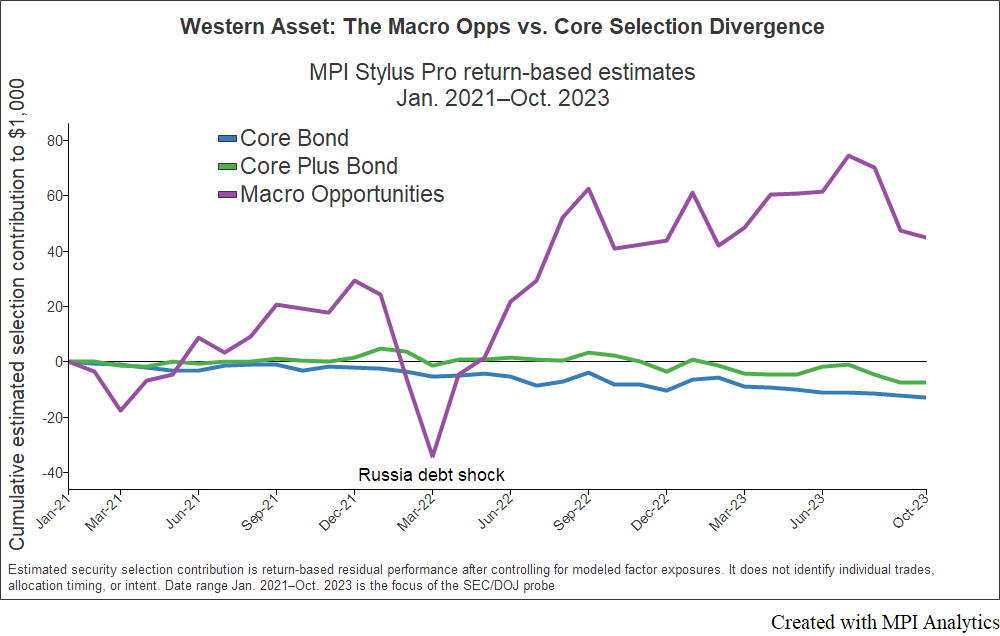
During the Jan. 2021–Oct. 2023 period covered by the SEC/DOJ allegations, Core and Core Plus show negative estimated selection contribution that gradually slips lower. Macro Opportunities looks very different. Its estimated selection contribution drops sharply around the early-2022 Russia debt shock, then rises rapidly and persistently.
That does not prove misconduct.
But it does show a notable divergence across related portfolios: Macro Opportunities on one side, Core and Core Plus on the other. That is directionally consistent with the economic split described in the legal record.
What Core and Core Plus investors experienced
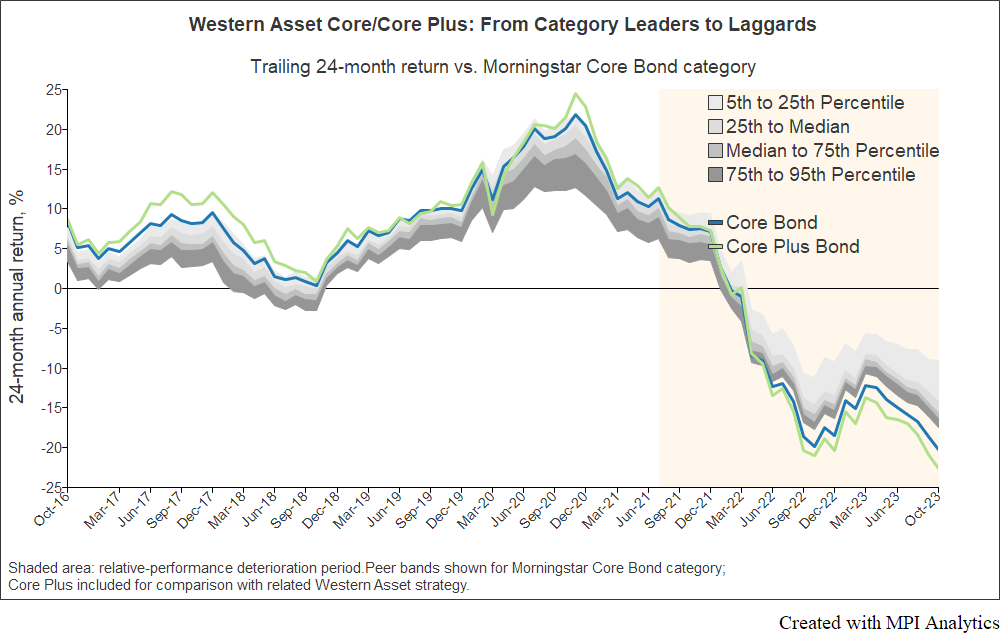
For Core and Core Plus investors, the effect is visible in the rolling 24-month return chart below.
The funds had been strong relative performers earlier in the period. But starting in the second half of 2021, their relative performance began to deteriorate sharply. By 2023, the funds had moved toward — and in places below — the lower end of the peer distribution.
For simplicity, the chart compares both funds to the Morningstar Intermediate Core Bond category, although Core Plus belongs to a different category. The point is not the precise category ranking. The point is the timing and severity of the deterioration.
The same period that shows rising estimated selection contribution for Macro Opportunities shows Core and Core Plus sliding rapidly from category leaders to laggards.
Summary
The lesson is not that return-based analysis can detect cherry-picking. It cannot. Nor is the lesson that different outcomes across related products are automatically suspicious. They often are not.
The lesson is that when one senior PM or team manages multiple related products with overlapping opportunity sets, those products should not be reviewed only one by one.
They should also be screened together.
In the Western Asset / Leech case, the return record showed several patterns that, taken together, should have raised due-diligence questions: a star fund reversing sharply, Macro Opportunities developing more traditional core-bond exposure, Core and Core Plus deteriorating, and estimated selection contribution diverging across related portfolios during the period later central to the SEC/DOJ allegations.
Different outcomes may be fully explainable by mandate, liquidity, leverage, client objectives, or portfolio construction.
The point is to know when they are — and when they deserve a deeper look.
Related research
- The PIMCO Income Puzzle
- Identifying Liquidity Risk in Fixed-Income Mutual Funds
- “Go-Anywhere” Bond Fund Bets Finally Seem To Be Paying Off
- Selecting the Right Fund: How Big is the Blind Spot in Most Manager Screens?
MPI’s technology helps institutional investors, consultants, and oversight teams monitor fund exposures, selection effects, and unexplained performance changes across managers and related portfolios.
Learn how MPI Stylus Pro can support fund due diligence, monitoring, and surveillance workflows.
Technology Solutions
Trusted by


