Target Date Fund Research Series, Part I: Advantages of a Quant Approach to Glide Path Analysis
We demonstrate the advantages of using returns-based analysis in determining the effective glide-paths of Target-Date Funds vs. the stated ones
As target date funds (”TDFs”) become increasingly entrenched in investors’ retirement portfolios, plan sponsors and advisors do not miss the irony that these products, meant to simplify the investors’ decision process to the point of simply choosing the fund with the closest date to their intended retirement, can add a world of complexity to their own practices.
TDFs vary across a growing number of dimensions, from the to-vs.-through decision, active-vs.-passive, fees and so on, yet by far the most important determinant of a target date product’s performance is its asset allocation over time1 – summarized by the shape of its equity (or risky assets) “glide path” over long time horizons.
Dispersion in Glide Paths
One of the early criticisms of TDFs in general is that the “one size fits all” approach is as applicable to investment products as it is of anything else – that is, not very. This may have led to the breadth of choice now available, particularly across the glide path dimension. In this year’s Target Date Landscape report, Morningstar reported on nearly 60 series (the various “vintages” that make up a TDF family’s allocations for different retirement dates) managing $880 billion in assets and spanning 40 firms (obviously with some firms offering additional choice in the form of multiple series).
The dispersion in currently reported glide paths2 is visualized in Chart 1 below. Even ignoring outliers3, there is great variety in the equity holdings4 for any given target date, as well as the slope and landing points of the glide paths.
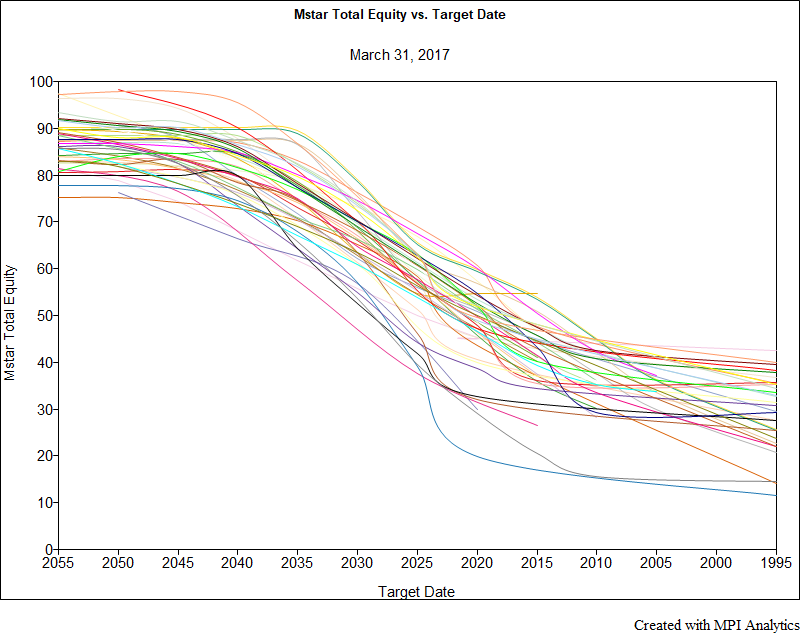 Chart 1
In this data set, and further ignoring the top and bottom 5%, a 27-year-old with a 2055 retirement-dated fund would have somewhere between 79% and 94% in equities while a 62-year-old holding a 2020 dated fund could have between 30% and 60% in equities. One need only to recall what happened to many near-dated funds in 2008 to see the implications to the risk of significant loss just before retirement. Equally important, however, is the risk of not having accumulated sufficient wealth by one’s retirement date as a result of being in overly conservative portfolios at various points during the retirement savings period.
Not all of a fund’s risk is tied to its gross equity exposure. There is a myriad of other considerations including, but certainly not limited to, sub-allocations (i.e. Emerging Markets vs. Large Cap Domestic), tactical allocations and underlying fund or security selection. However, the strong relationship is fairly clear in Chart 2 below, comparing the current equity holdings against observed max drawdown over the past 24 months, as those funds with higher equity tend to experience deeper drawdowns. There is ample supporting evidence that the asset mix is by far the most important factor in determining a portfolio’s return behavior and risk profile and this is no different for Target Date funds.
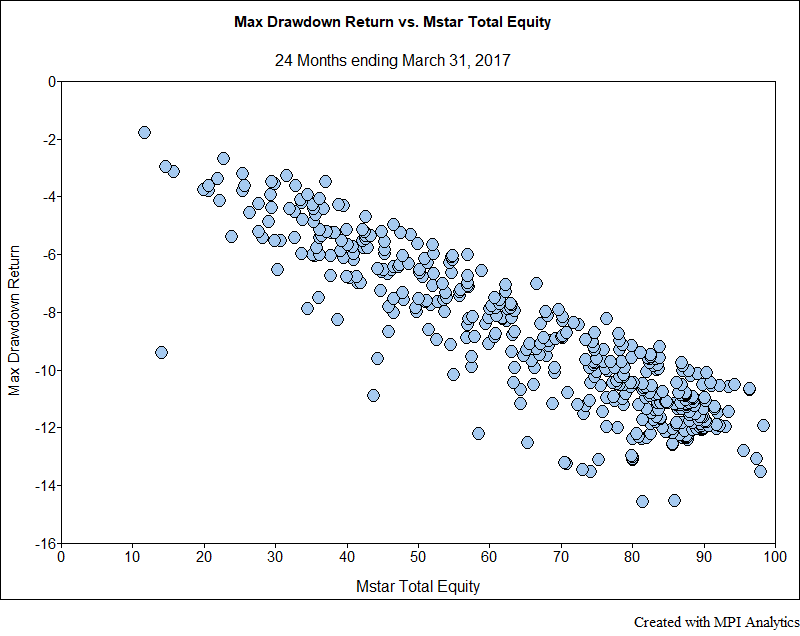 Chart 2
Style analysis is uniquely suited to enhance the analysis of Target Date funds, most particularly in terms of evaluating the critical element of the Equity Glide Path. We continue with an illustration of how it fares compared to other methods in the next section.
How well does Returns-Based Style Analysis (“RBSA”) work with TDF products – and why bother?
We’ve just finished examining how the holdings-based Equity Glide Path affects performance and risk of Target Date funds, as well as the broad range in options to choose from. What reasons could we have for using RBSA then if holdings information is available and provides decent information?
Returns-based style analysis and holdings based analysis, as we maintain for any investment product, typically complement each other and often fill in gaps that exist when just using one approach. That said, there are a number of perceived advantages to the use of Style Analysis when working with many investment products or portfolios. First, by using only returns, the data required to compile our equity estimate can be made available on a daily basis, so it is always current. Holdings are usually available less frequently, either monthly or quarterly and often with an additional lag. For a dynamic portfolio such as TDFs, this may cause the analyst to miss critical information. Second, holdings information is often available only as a snapshot – a single point in time. Style analysis estimates always provide historical behavior as well, allowing one to assess “style drift” or measures of style consistency. Third, Style analysis can be run on thousands of investment products in minutes, while compiling holdings information can be a lengthy process with non-uniform “portfolio dates” across products. If one simply acquires compiled holdings information, the effort of compiling it is eliminated, but at the expense of some clarity and transparency. With RBSA, exposures are always directly comparable from fund to fund and easily interpreted in terms of weights in the factor indexes. Lastly, returns-based style analysis allows one to choose from thousands of factors to help explain the behavior of a given product, allowing one to examine exposure to an almost limitless array of factors across macro-asset, micro, country/regional, industry/sector, currency, risk factors, etc.
Most of the time, as we would expect, RBSA estimates using typical asset-based factors correspond closely to holdings-based information. In Chart 3 below, we compare the estimated equity exposures calculated using MPI’s Dynamic Style Analysis (DSA)5 to the total equity holdings as stated in the Morningstar database6. With a few notable exceptions (to which we will return shortly, and are precisely those series that were excluded in the previous section), the relationship is very close. Some discrepancies in the mainstream cases are to be expected for a number of reasons, including but not limited to: mismatch between holdings portfolio date and returns estimate date, recent changes due to tactical allocation or drift, and the subjective composition of the equity basket7.
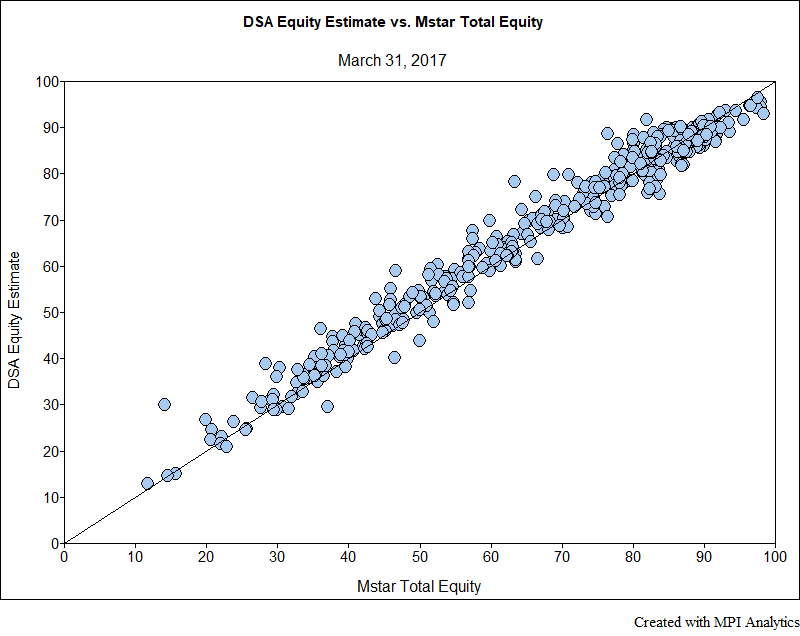 Chart 3
Narrowing the field for an alternate holdings-based comparison, we do this again for the 15 largest target date series by assets8. Instead of Equity holdings values from Morningstar, this time we use the equity allocations published by the individual funds9. This produces 162 individual funds, with Target Dates ranging between 2060 to Retirement Income funds. These similarities can be seen in Chart 4. The average difference in equity exposure for the 162 individual funds is 1.9%.
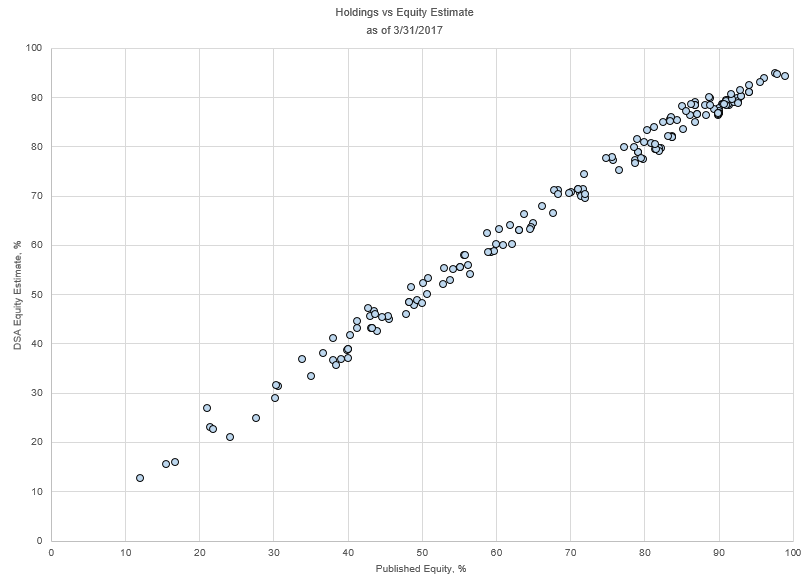 Chart 4
For additional verification, we also compare the differences between these series and the same Morningstar database holdings values above and finally the differences between the Morningstar holdings database and the funds’ published holdings literature. It may seem counter-intuitive that there would be any difference between the Morningstar database and recent values from the funds themselves, as they are both holdings-based. However, there can still be issues with mismatched dates, as well as differences in what funds publish, whether it is a strict tally of underlying holdings, the sum of underlying funds’ categories or even economic exposure. The average difference between DSA estimates and Morningstar holdings is 2.6%, while the average difference between Morningstar and fund holdings literature is 2.5%. These values are not only encouraging in terms of validating the use of RBSA in quickly comparing equity glide paths across the entire target date spectrum, but they also lead directly into the next topic: Returns-based style analysis may be fast, inexpensive and easy – but what happens when it doesn’t agree with holdings-based exposures?
Footnotes
- 1Sharpe, William F. “Determining a Fund’s Effective Asset Mix,” Investment Management Review, December 1988, pp. 59-69
- 2Sum of Morningstar US Mutual OE Funds database fields, “% US Stocks” and “% Non-US Stocks” which in turn are based on funds’ reported holdings.
- 3Six outlier series (PIMCO, Putnam, Mass Mutual, Harbor, BlackRock Dynamic and Invesco) have been removed from this and several subsequent charts for clarity.
- 4As reported by Morningstar.
- 5Factors used in the analysis are indices representing US Equities, International Developed and Emerging Market Equities, Real Estate, Commodities, US Bonds and International Developed and Emerging Market Bonds. For this comparison, the equity portion consists of the sum of all of the Equity exposures plus Real Estate and Commodities.
- 6Sum of Morningstar US Mutual OE Funds database fields, “% US Stocks” and “% Non-US Stocks”
- 7For example, the MPI calculation includes Commodities with the equity basket, as do a number of Target Date series in their reported totals. They may be found under “Other” however, in the Morningstar database.
- 8American Century One Choice, American Funds Target Date Retirement, BlackRock LifePath Index, Fidelity Freedom, Fidelity Freedom Index, John Hancock Multi-Index Preservation, John Hancock Multimanager Lifetime, JP Morgan SmartRetirement, Principal LifeTime, State Farm LifePath, T. Rowe Price Retirement, TIAA-CREF Lifecycle, TIAA-CREF Lifecycle Index, Vanguard Target Retirement and Wells Fargo Advantage DJ Target.
- 9When compiling holdings data for funds based on published literature, where possible we use totals provided by asset class from the funds for the most recent date available. Where this was not available we sum the holdings by stated objective of the underlying funds. In these cases the total refers to the focus of underlying funds (i.e., a Large Growth fund will be fully accounted for in the Equity total, even if it holds a relevant amount of cash or bonds). The difference between this and a bottom up tally of securities may be a source of discrepancy.
Trusted by


