Multiple Shades of “Green”: UPenn’s Cash Flow Dilemma
According to our analysis, UPenn’s liquidity problem is real—but somewhat different from those faced by other elite schools. Dartmouth emerges as the most resilient to cash flow pressures.
Related research: Elite U.S. Endowments: Government Funding and Liquidity Pressure • A Private Equity Liquidity Squeeze By Any Other Name • The Great Private Equity Squeeze of 2023 • FY2023 Ivy Report Card: Volatility Laundering and the Hangover from Private Markets Investing
The University of Pennsylvania was the latest among elite schools to issue debt this year. According to Buyout Insider, on May 15, UPenn’s Budget and Finance Committee approved the issuance of $300 million in debt, in addition to another $300 million approved in January—bringing the total amount of debt to nearly $5 billion. The board also increased its line of credit to $600 million, up from $100 million previously, noting that this action would serve as an “insurance policy” against liquidity pressures.
These pressures are real. In March of this year, the Trump administration suspended $175 million in federal funding to UPenn over its policies regarding transgender athletes. While the battle over these funds is still ongoing, it’s worth noting that creating a liquidity buffer of over $1 billion seems disproportionately large compared to the potential “budget hole.”
Almost a year ago, we conducted a detailed analysis of elite school endowments and concluded that outsized, illiquid private asset allocations had led to liquidity pressures even more severe than those during the global financial crisis of 2008. And that was well before any government funding cuts or tariff-induced market volatility.
We recently updated our research and found that by raising debt and selling significant chunks of their private equity (PE) portfolios in the secondary market, both Yale and Harvard were addressing cash flow problems caused by outsized unfunded PE commitments and record-low PE distributions—rather than by federal funding cuts. In the MPI Transparency Lab’s diagram below, Brown, Yale, and Harvard show some of the highest liquidity risk (Y-axis), as measured by the ratio of endowments’ unfunded PE commitments to MPI-estimated liquid assets.
Note UPenn’s unique position next to the Ivy League (8-school) average. Although its liquidity risk is not as high, its government funding risk (X-axis) is higher than that of most larger Ivies. In the current environment—marked by record-low PE distributions and the real possibility of losing research grants—both risk dimensions add up and could lead to some of the highest levels of stress.
Columbia’s liquidity stress is of a different kind: the school’s budget heavily depends on government funding (X-axis), compared to all other Ivies (except Cornell). That, combined with the low liquidity of its endowment, makes it extremely vulnerable to funding cuts.
UPenn’s liquidity story is complex—like Tolstoy said, “All happy families are alike; each unhappy family is unhappy in its own way.” And UPenn’s is definitely unique.
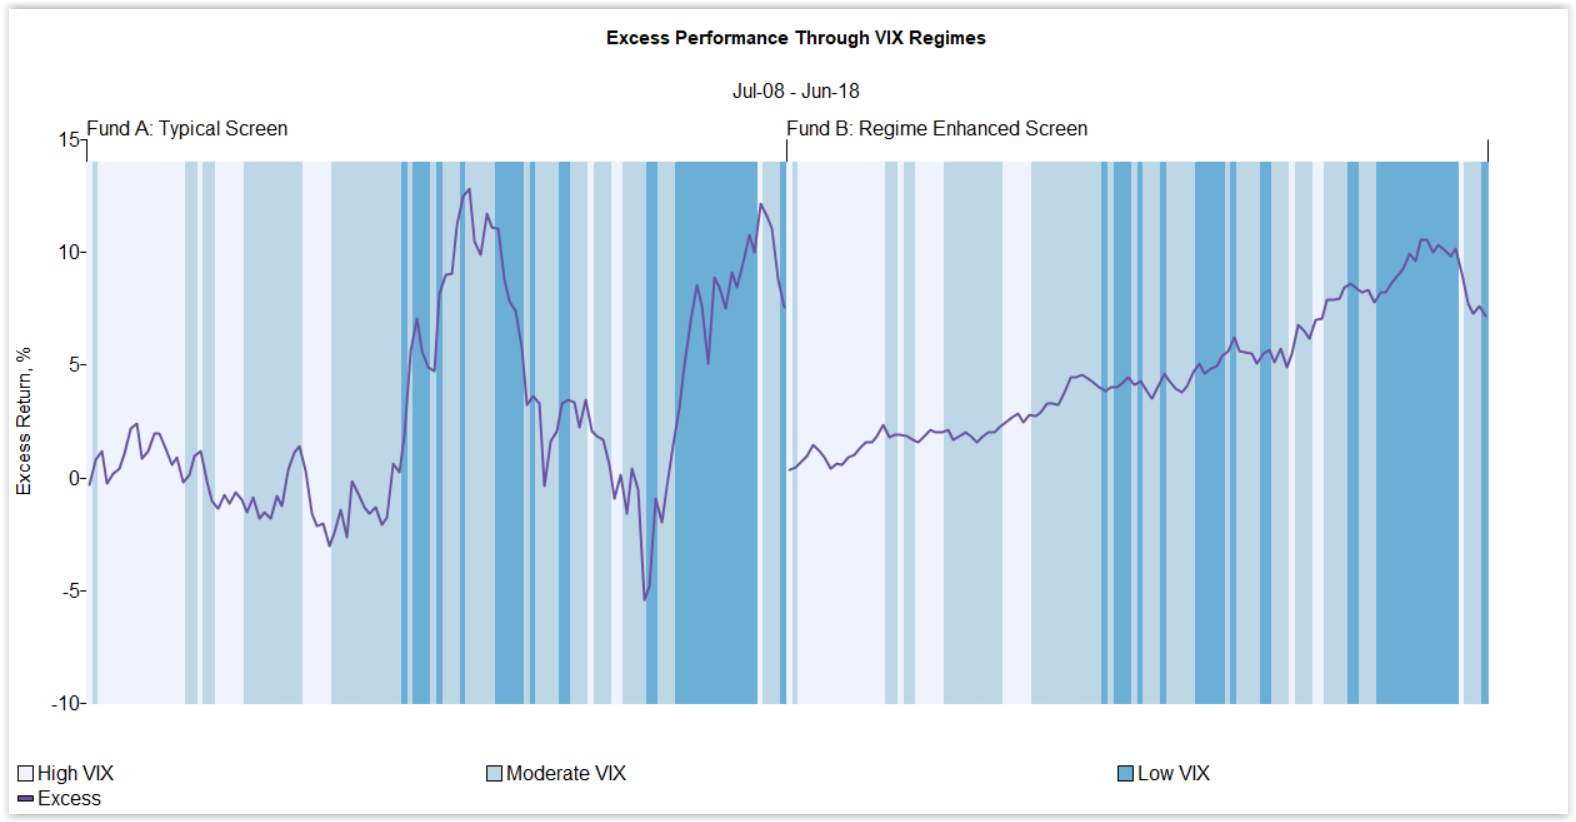
Assess a fund’s potential exposure to complex hypothetical market shocks or historical regimes in MPI Stylus Pro.
According to the cited article, the $22.3 billion endowment’s private equity position constitutes 18.4%, which is lower than the 19.4% average for endowments with $5 billion or more in AUM. However, this number is incorrect. According to UPenn’s latest FY2024 financial statements, the endowment has $8.5 billion allocated to private equity—representing 35.5% of the total investment portfolio value—which is nearly double the number stated in the article.
In the chart below, “Elite Endowment Liquidity Stress Map FY24,” featured in MPI Transparency Lab, we show MPI-estimated PE allocations as a percentage of total assets (Y-axis), and the proportion of unfunded PE commitments to the sum of total allocated and committed PE dollar values (X-axis). UPenn’s allocation to PE is close to the average Ivy endowment allocation of 36.8% and doesn’t appear problematic on its own. However, UPenn’s cash flow deficiency could be more severe than that of schools with a much higher percentage allocation to illiquid private equity.
The ratio on the X-axis is a good measure of the vintage age of a PE portfolio. Other things being equal, the higher this ratio, the younger the portfolio. For example, for a newly formed PE portfolio, this ratio is 100%. After two years into the investment period, it could fall to around 33% (assuming a three-year investment period with zero growth and distributions). When the portfolio is fully allocated (years 3–5, for example), the ratio approaches zero.[1]
So why is the average vintage so important? PE funds in the investment period are less likely to produce sizable distributions. It’s during the “harvesting period” that distributions (hopefully) begin in full swing.
In our 2023 analysis of CalPERS’ PE portfolio—using Preqin data—we illustrated how its significant allocation to private equity affected the average vintage age and created a liquidity squeeze for the pension fund.
As seen in the diagram, Dartmouth has the most mature vintage of all elite schools’ PE investments. UPenn and Columbia, on the other hand, have the least mature (by our very crude estimates, N.B.) PE portfolios and, consequently, potentially lower probabilities of significant PE distributions. PE distributions are typically used by investors to fund capital calls on committed PE investments. So, even though UPenn’s level of unfunded commitments isn’t as high as those of other schools, below-average cash inflows from PE investments will create demand for liquidity.
Saves time and money with MPI’s comprehensive software platform that provides both historical and forward-looking analysis capabilities
According to FY24 financial statements, UPenn had $3.58 billion in unfunded PE commitments. Add to that the PE distribution drought of the past two years, and we begin to understand why the school had to shore up an additional $1 billion in liquidity. It has very little to do with the potential $175 million loss in government funding. That loss hurts, of course—but the scale is different.
Dartmouth, on the other hand, stands out for its resilience. With just $710 million in unfunded PE commitments (per FY24)—the lowest in the group—it also has both the lowest funding risk and the lowest liquidity risk (second only to Cornell). In many ways, Dartmouth represents a best-case scenario in navigating today’s liquidity challenges: a conservative (average) PE exposure, a mature portfolio, and limited dependence on government support. It’s a rare example of an elite school that seems to have struck the right balance.
As FY25 is set to close in just over a week, we hope FY26 will bring tremendous economic growth in both public and private sectors, and that FY25 stress will become a lesson learned—filed away in the “lessons learned” book.
_______________
[1] Of course, this is a very simplified illustration and the inverse relationship between unfunded commitments and vintage age is much more nuanced.
Technology Solutions
Trusted by


