MPI Transparency Lab
Free, returns-based transparency for elite endowments and pensions: performance, risk, liquidity, attribution, and effective exposures—even when institutions disclose only annual results.
The detailed individual endowment PDF reports are free with registration
 ✔️FY25 Endowments: AI and Crypto to the Moon
✔️Princeton’s declining returns: an equity hedge story
MPI Elite Endowment Tracker
Fiscal years ending June; 3-year, 5-year, 10-year and 20-year returns are annualized. Risk estimates are standard deviation estimates based on either historical (“Risk (Historical)” column) or the most recent (“Risk (current)” column) estimated fund exposures (obtained through dynamic analysis of annual returns) and quarterly returns of the explanatory risk factors over a 10Y trailing window. “10Y Stdev Annual” is standard deviation of endowments’ 10 trailing reported annual returns, rather than the Lab’s estimates (“Risk (Historical)”).
70-30 Global Benchmark is a quarterly rebalanced portfolio of 70% MSCI ACWI Index and 30% Bloomberg Barclay Aggregate Bond Index. Benchmark standard deviations are computed using quarterly returns to make them comparable to our risk estimation methodology.
04/29/2025: Liquidity analysis tab has been updated with FY2024 numbers. Estimated Brown’s unfunded PE commitments.
05/7/2025: Added “Elite Endowment Liquidity and Government Funding Risk” diagram to the Liquidity tab below
11/5/2025: Elite endowments’ performance, 10Y-risk and attribution numbers have been updated with FY25 results. Reports and risk/SR estimates will follow shortly
Would you like a free report on an endowment that is not in the table?
- Size
- Return
- Attribution
- Risk
- Risk/Return
- Efficiency
- Liquidity
| Num | Asset Class | Index Proxy | FY2023 | FY2024 | FY2025 |
|---|---|---|---|---|---|
| 1 | US Bonds | Bloomberg U.S. Aggregate Bond Index | -0.9 | 2.6 | 6.1 |
| 2 | US Equity | S&P 500 Index | 19.6 | 24.6 | 15.2 |
| 3 | Developed Equity | MSCI EAFE ND USD Ind | 18.8 | 11.5 | 17.7 |
| 4 | Emerging Equity | MSCI EM (Emerging Markets) ND USD | 1.7 | 12.5 | 15.3 |
| 5 | Technology | S&P 500 Information Technology Ind | 40.3 | 41.8 | 15.1 |
| 6 | Natural Resources | Preqin Natural Resources Ind | 3.1 | 8.1 | 9.3 |
| 7 | Real Estate | Cambridge Associates Real Estate | -1.9 | -3.9 | 1.1 |
| 8 | Private Equity | Cambridge Associates U.S. Private Equity | 6.2 | 6.9 | 9.0 |
| 9 | Venture Capital | Cambridge Associates U.S. Venture Capital | -10.2 | -1.4 | 9.9 |
| 10 | PitchBook AI Unicorn | Morningstar PitchBook AI Unicorn Index | 12.2 | 20.7 | 53.6 |
| 11 | Diversified Alts | Eurekahedge 50 | 2.7 | 8.1 | 8.4 |
| 12 | Hedge Funds | HFRI Fund Weighted Composite Index | 5.0 | 9.9 | 8.4 |
| 13 | Digital Assets Alts | With Intelligence Digital Assets Hedge Funds | 32.6 | 83.2 | 52.2 |
*MPI Standard deviation estimates are based on the most recent estimated fund exposures (obtained through dynamic analysis of annual returns) and quarterly returns of risk factors over 10-year trailing estimation window.
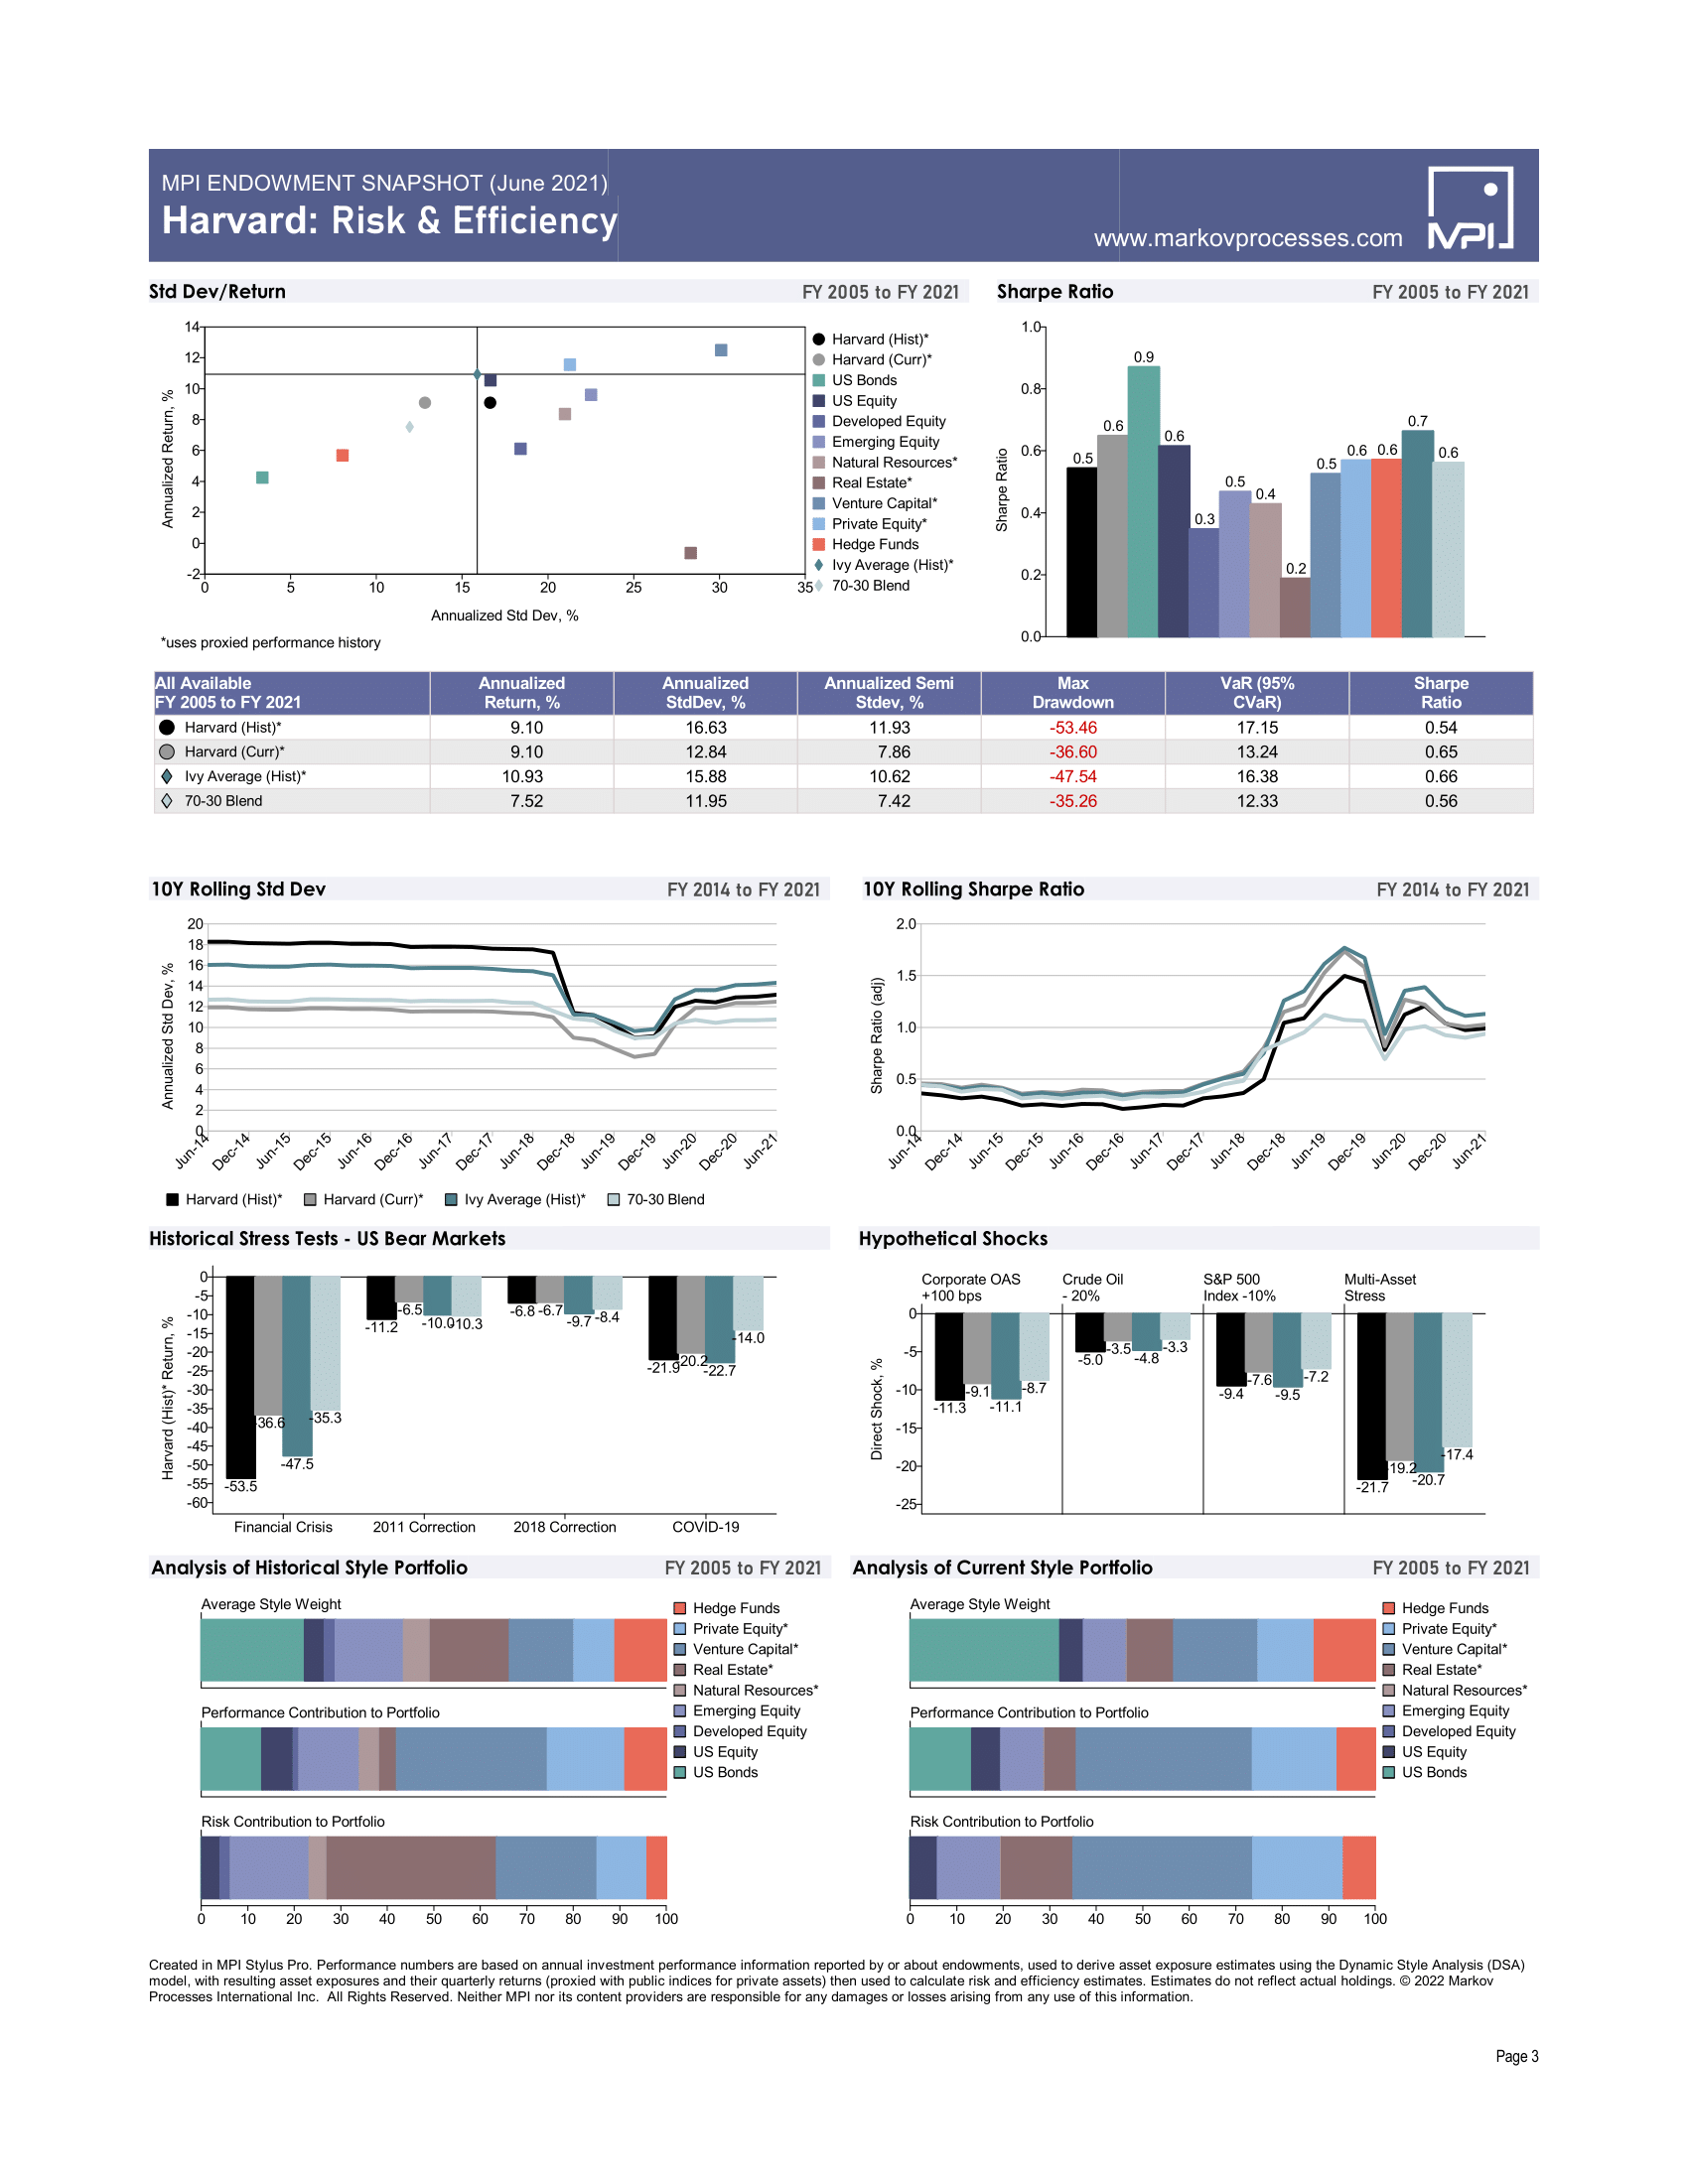
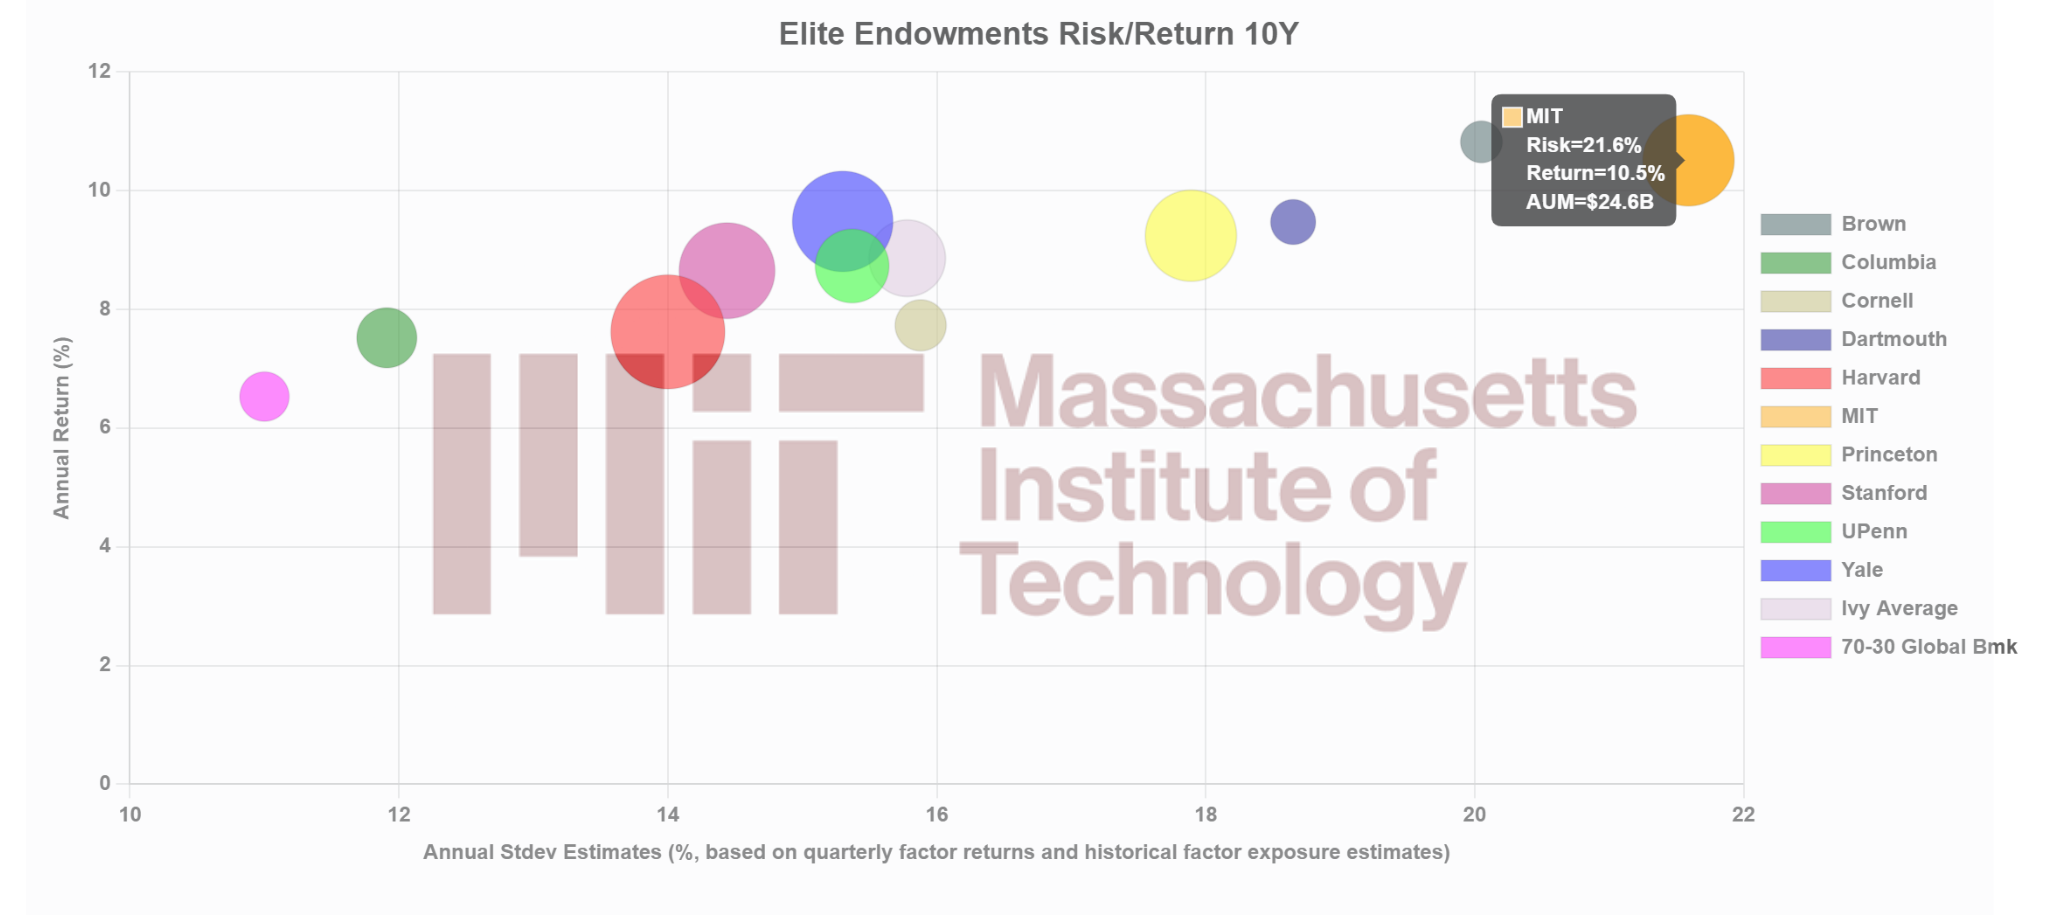
The standard deviation estimates depicted in the diagram below are based on historical fund exposures and quarterly returns of risk factors over a 10-year trailing window. These exposures are obtained through dynamic analysis of annual returns using MPI Stylus Pro. The Y-axis on both charts shows the 10-year average annual returns (geometrically compounded).
The standard deviation estimates shown on the X-axis of the diagram below are derived from the last ten annual returns reported by each endowment.
*Sharpe Ratio calculation is based on a) 10-year reported annual returns and b) quarterly standard deviation estimates based on historical fund exposures (obtained through dynamic analysis of annual returns) and quarterly returns of risk factors over 10Y trailing estimation window.
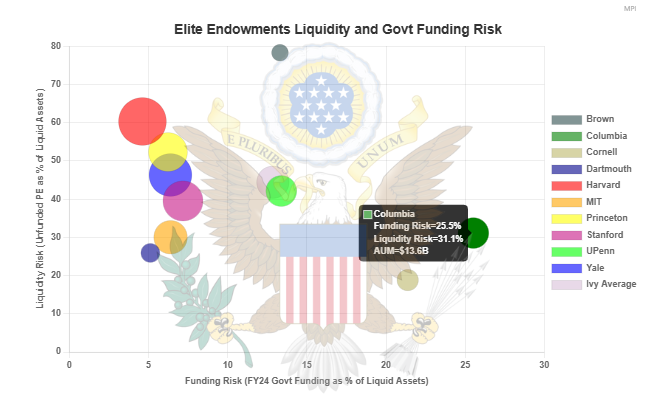
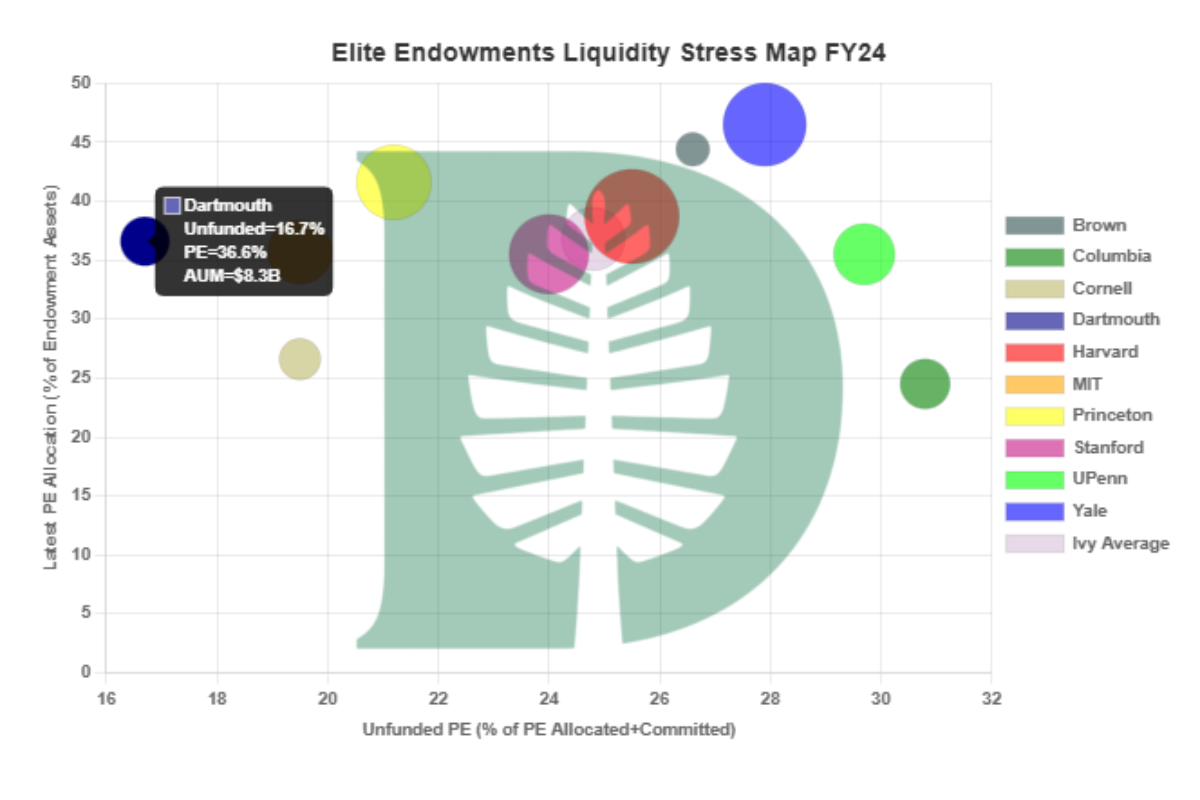
Endowment Liquidity Analysis
This analysis of elite endowments’ liquidity-associated risks is based on schools’ latest (FY24) annual financial statements.[1] We focus on Private Equity(PE+VC) exposure as the main source of risk and stress due to its highly illiquid nature and its prominence in the “Yale Model” (25%-45% of the AUM for Ivys).[2]
How to interpret the following diagram:
- Generally speaking, the higher the portion of an endowment’s PE allocation that is unfunded (X-axis) -> the younger the average vintage of an endowment’s PE portfolio -> the lower the cash distributions from the LP’s PE portfolio likely are -> the less money the LP will have on hand that can be allocated to future capital calls from the GPs.[3]
- PE is one of the most illiquid assets in an endowment’s portfolio. The higher an endowment’s allocation to PE is (Y-axis), the greater the liquidity stress that could arise in a time of crisis.
- “Ivy Average” could be used as a reference point for both stress and exposure to PE of individual endowments.
- Size of the dots corresponds to assets.
The funding of capital calls typically comes from two sources: 1. The liquid portion of the endowment portfolio and 2. Distributions from the existing allocation to PE. Both sources of funding represent risks, which are illustrated as bars in the following diagram:
- The higher the ratio of unfunded PE commitments to the liquid portion[4] of an endowment, the greater the challenges for the endowment to meet capital calls.
- The higher the unfunded portion of a PE allocation is, the lower the cash distributions will likely be coming from GPs that can be allocated towards future capital calls.
Liquidity risk and market risk should not be looked at in isolation as market drawdowns exacerbate liquidity pains. The following diagram compares endowments’ liquidity risk — defined as a ratio of unfunded PE commitments to the liquid portion[4] of the endowment portfolio (Y-axis) — with estimated market risk (X-axis)[5].
The actual dollar amounts of unfunded commitments add an extra layer to our liquidity analysis. Higher amounts of unfunded commitments could lead to exponentially greater liquidity stress, assuming all other factors remain constant.
FY2025 was marked by disruptions in federal funding to elite institutions. The diagram below, titled “Elite Endowment Liquidity and Government Funding Risk,” was added to illustrate the two key dimensions of funding risk: (1) the obligation to meet PE capital calls and (2) the shortfall in operational budgets caused by canceled government grants. Analyzing these together is essential, as both PE capital calls and research funding rely on the same pool of liquid assets when grants are delayed or lost.
The diagram plots endowments’ estimated government funding risk on the X-axis—measured as the ratio of FY24 U.S. grants[6] to the liquid portion of the endowment portfolio—and liquidity risk on the Y-axis—defined as the ratio of unfunded PE commitments to the same liquid portion. Total funding risk can be interpreted as the sum of these two dimensions, bearing in mind that PE capital calls are typically spread over multiple years.
This table contains source data for the charts above.[7] Please note that sorting columns in the table affects the order of bar-charts. Real Assets column includes Real Estate, Nat Resources and also Private Credit where it is disclosed separately (e.g., Princeton.)
[1] Endowment asset allocation numbers above were derived from 2024 endowment annual reports/financial statements except for Brown, Princeton and Harvard, which published endowment asset allocation information. Because financial statements cover the schools’ general accounts, which contain non-endowment assets, the computed allocations may differ slightly from actual. For Yale, in 2024 this represents 6% of net investments, for Dartmouth 16%. Liabilities or other assets that are present in the annual reports and/or financial statements and can’t be classified are omitted from the charts due to uncertainty of their nature. For Yale, for example, in 2024 this represents 2% of net investments.
[2] Private Equity (PE) exposure includes also Venture Capital (VC) because most endowments report combined PE (buyout and growth) and VC allocations. On rare occasions where they are listed separately in financial statements (e.g., Brown and Yale), we combine them. Brown’s unfunded commitments are reported combined for PE, private credit and real assets. The unfunded PE commitment figure for Brown is MPI’s estimate based on the average unfunded PE commitments to total commitments across other 9 schools.
[3] Said differently, how funded or unfunded an endowment’s PE allocation is (X-axis) typically corresponds to average fund maturity/age, which in turn has a relationship to the likelihood of cash distributions from the PE portfolio. Such distributions can be allocated to future capital calls. Unfunded PE shown is a percentage of the total PE allocation and commitment (including the unfunded portion).
[4] For liquid assets we use the sum of Cash/Short-term, Bonds and Equity allocations. Not all of it could be available on daily, monthly or quarterly notice. The actual liquid assets could be significantly less than the stated number.
[5] For market risk we use annualized standard deviation estimates based on the most recent estimated fund exposures (obtained through dynamic analysis of endowments’ annual returns) and quarterly returns of risk factors over 10-year trailing estimation window
[6] Elite endowment U.S. federal grant numbers are from endowment FY24 annual reports and USA Spending website (for Dartmouth and UPenn). We have not included federal grants related to SLAC for Stanford and Lincoln Lab for MIT, as both labs are government-owned.
[7] The data in this table comes from financial statements and could differ from the official endowment allocation numbers as reported by several schools. Since endowment represents a portion (albeit the dominant one) of the investment portfolio, such reported allocations can be off by several percentage points.
Disclaimer
Some statistics on this page are based on exposure estimates obtained through quantitative analysis and, beyond any public information, MPI does not claim to know or insinuate what the actual strategy, positions or holdings of the funds are, nor are we commenting on the quality or merits of the strategies. Deviations between our analysis and the actual holdings and/or management decisions made by funds are expected and inherent in any quantitative analysis. MPI makes no warranties or guarantees as to the accuracy of this statistical analysis, nor does it take any responsibility for investment decisions made by any parties based on this analysis.
The detailed individual pension PDF reports are free with registration
MPI Pension Tracker
*As of June 2023; 3-year, 5-year and 10-year returns are annualized. Standard deviation estimates are based on either historical or the most recent fund exposures (obtained through dynamic analysis of annual returns) and quarterly returns of risk factors over 10-year trailing window. 60-40 Global Benchmark is a quarterly rebalanced portfolio of 60% MSCI ACWI Index and 40% Bloomberg Barclay Aggregate Bond Index.
06/24/2024: All pension charts and tables updated with 2023 Fiscal Year data.
Would you like a free report on a pension fund that is not in the table?
- Size
- Return
- Attribution
- Risk
- Risk/Return
- Efficiency
- Funding
- Red Flags
*Standard deviation estimates are based on the most recent estimated fund exposures (obtained through dynamic analysis of annual returns) and quarterly returns of risk factors over 10-year trailing estimation window.
*Standard deviation estimates are based on historical fund exposures (obtained through dynamic analysis of annual returns) and quarterly returns of risk factors over 10-year trailing window.
*Sharpe Ratio calculation is based on a) 10-year reported annual returns and b) quarterly standard deviation estimates based on historical fund exposures (obtained through dynamic analysis of annual returns) and quarterly returns of risk factors over 10-year trailing estimation window.
*Standard deviation estimates are based on the most recent estimated fund exposures (obtained through dynamic analysis of annual returns) and quarterly returns of risk factors over 10-year trailing estimation window. Funded ratio source: Public Plans Data;
Underestimation of Pension Risk
Autocorrelation in fund returns frequently leads to underestimation of market risk. In many cases such autocorrelation is caused by allocations to illiquid assets with stale NAVs such as private equity, private credit and real assets. To identify pensions with such issues we compute Durbin-Watson (DW) statistics of their annual returns (lower DW values imply more significant autocorrelation). We provide additional tests for autocorrelation in the table below for statistically inclined.
*Standard deviation estimates and Durbin-Watson statistic are based on trailing 10 years of public annual returns (through June 2023). On a 5% significance level, DW<0.9 indicates strong autocorrelation, 0.9<DW<1.3 – potential autocorrelation and DW>1.3 – no positive autocorrelation. Please see DW Statistical Tables for details. More on Durbin-Watson and liquidity. Note that quarterly returns may exhibit much higher levels of autocorrelation.
The above chart compares volatility estimates using pension reported annual returns (X-axis) with the MPI approach based on quarterly returns of a factor-model proxy portfolio (Y-axis)
Autocorrelation Statistics
(first order autocorrelation tests)
Annual return data sources:
- Public Plans Data. Center for Retirement Research at Boston College, MissionSquare Research Institute, National Association of State Retirement Administrators, and the Government Finance Officers Association.
- Pension funds’ annual reports.
Disclaimer
Some statistics on this page are based on exposure estimates obtained through quantitative analysis and, beyond any public information, MPI does not claim to know or insinuate what the actual strategy, positions or holdings of the funds are, nor are we commenting on the quality or merits of the strategies. Deviations between our analysis and the actual holdings and/or management decisions made by funds are expected and inherent in any quantitative analysis. MPI makes no warranties or guarantees as to the accuracy of this statistical analysis, nor does it take any responsibility for investment decisions made by any parties based on this analysis.
The detailed individual PDF reports are free with registration
On Demand Endowment Reports
| Name | Endowment | MPI360 Report | AUM ($B) | FiscalYear | Return | Commentary |
|---|---|---|---|---|---|---|
| Rutgers University | Rutgers | 1.8 | 2022 | -9.7 | FY2022: A Tough Year for Rutgers | |
| Duke University | Duke | 12.1 | 2022 | -1.5 | Duke Endowment to the Moon | |
| Oklahoma State University | Oklahoma State | 0.8 | 2022 | -1.9 | Coming soon | |
| University of Chicago | UChicago | 10.3 | 2022 | -8.8 | University of Chicago's Endowment FY2022 Risk Premia Story | |
| Michigan State | MSU | 4.4 | 2024 | 15.1 | Solving the Biggest Puzzle of the 2024 Endowment Season |
We are constantly adding to our list of available reports. Would you like us to cover a specific endowment/pension?
Disclaimer
Some statistics on this page are based on exposure estimates obtained through quantitative analysis and, beyond any public information, MPI does not claim to know or insinuate what the actual strategy, positions or holdings of the funds are, nor are we commenting on the quality or merits of the strategies. Deviations between our analysis and the actual holdings and/or management decisions made by funds are expected and inherent in any quantitative analysis. MPI makes no warranties or guarantees as to the accuracy of this statistical analysis, nor does it take any responsibility for investment decisions made by any parties based on this analysis.
For 25 years, MPI’s clients have used our tools to gain insight into some of the largest and most sophisticated investment products. Now, for the first time, MPI is making available free, proprietary analyses and reports on specific endowments and pensions to help everyone understand most fundamental potential drivers of their investment behavior.
Driven by our MPI Stylus Pro technology, these MPI-360 transparency reports shine a light on portfolio return, risk, and effective asset-class exposures in a way unavailable anywhere else. Whether you are an institutional investor, asset manager, wealth advisor, researcher, or journalist, you can read below to learn why we believe transparency into these impactful portfolios is important and how we go about pulling back the curtains on their behavior.
And, of course, you can contact us to speak with MPI and learn why MPI is the provider of choice for anyone seeking to understand complex fund and portfolio behavior for which limited data is available.
- 1. Why Transparency?
- 2. Why MPI?
- 3. Methodology
- 4. MPI-360 Reports
- 5. FAQ
1. Why Transparency?
College and charitable endowments, pension funds, hedge funds, sovereign wealth funds…even as frustrated stakeholders call for greater transparency, the world’s largest and most important investments tend to remain shrouded in mystery. Yet the larger these funds get, the more they may not only be affected by markets, but also exert an influence on markets, both public and private. It’s fair to wonder what exactly is inside these tax-sheltered or tax-advantaged investing machines.
MPI remains committed to helping investment professionals, stakeholders, and the public form a clearer picture of these investment giants and their behavior through our endowment transparency and pension transparency reports.
Endowment Transparency
College endowments are famously opaque, providing so little information that their once-a-fiscal-year reports have become a regular autumn spectacle. But seldom do these reports contain much real information about how endowments achieve results, how they decide which risks to take, or how outsiders can independently verify their results.
Disclosures from endowments are minimal, typically consisting of annual performance figures, updates to policy portfolios and general commentary. Endowments often have highly restrictive media policies. Even many institutional consultants struggle to explain top-tier endowment results. Although much has been written on the endowment model for investing by gurus like Yale CIO David Swensen, those seeking to understand tactical allocation shifts, strategy preferences, and manager selection are given little to work with on an ongoing basis.
Pension Transparency
U.S. pension funds have been plagued by chronic underfunding, decreased disclosure, and even allegations of criminal behavior. Stakeholders don’t have the option of moving their money elsewhere. MPI believes that stakeholders in public, union, and other pensions should be able to:
- Validate pension disclosures and reconcile them with actual returns.
- Identify the risks pension funds take.
- Assess whether pension fund risk exposure has resulted in commensurate returns.
- Determine whether current levels of risk are appropriate for a fund’s stated risk tolerance.
2. Why MPI?
MPI is a leader and innovator in helping large investors understand complex portfolio dynamics and the drivers of return and risk.
That’s why government regulators, top institutional investors, and investment management organizations look to MPI as part of their fund due diligence and surveillance toolbox. And it’s why investigative reporters use us to help uncover red flags (like in our analysis of a feeder fund to Bernie Madoff’s strategies.)
The same technologies that drive our products and services were recognized with best academic paper prizes. Here are some of the unique benefits MPI brings to the industry:
- Strategy validation. Was it possible to achieve reported results using reported allocations? Can one trust the returns or allocations? Are there hidden risks?
- A common denominator for comparing opaque investments. Every endowment or pension fund is unique in how it defines asset classes and categories of alternative investments, making apples-to-apples comparisons very difficult. Our tools can standardize allocation types across endowments, allowing a meaningful picture for comparison.
- Netting exposures. Effective equity and fixed income exposures can be netted by shorting, leveraging, or the use of derivatives. Risk managers and CIOs use our factor analysis to uncover hidden exposures that truly drive returns – often unexpectedly.
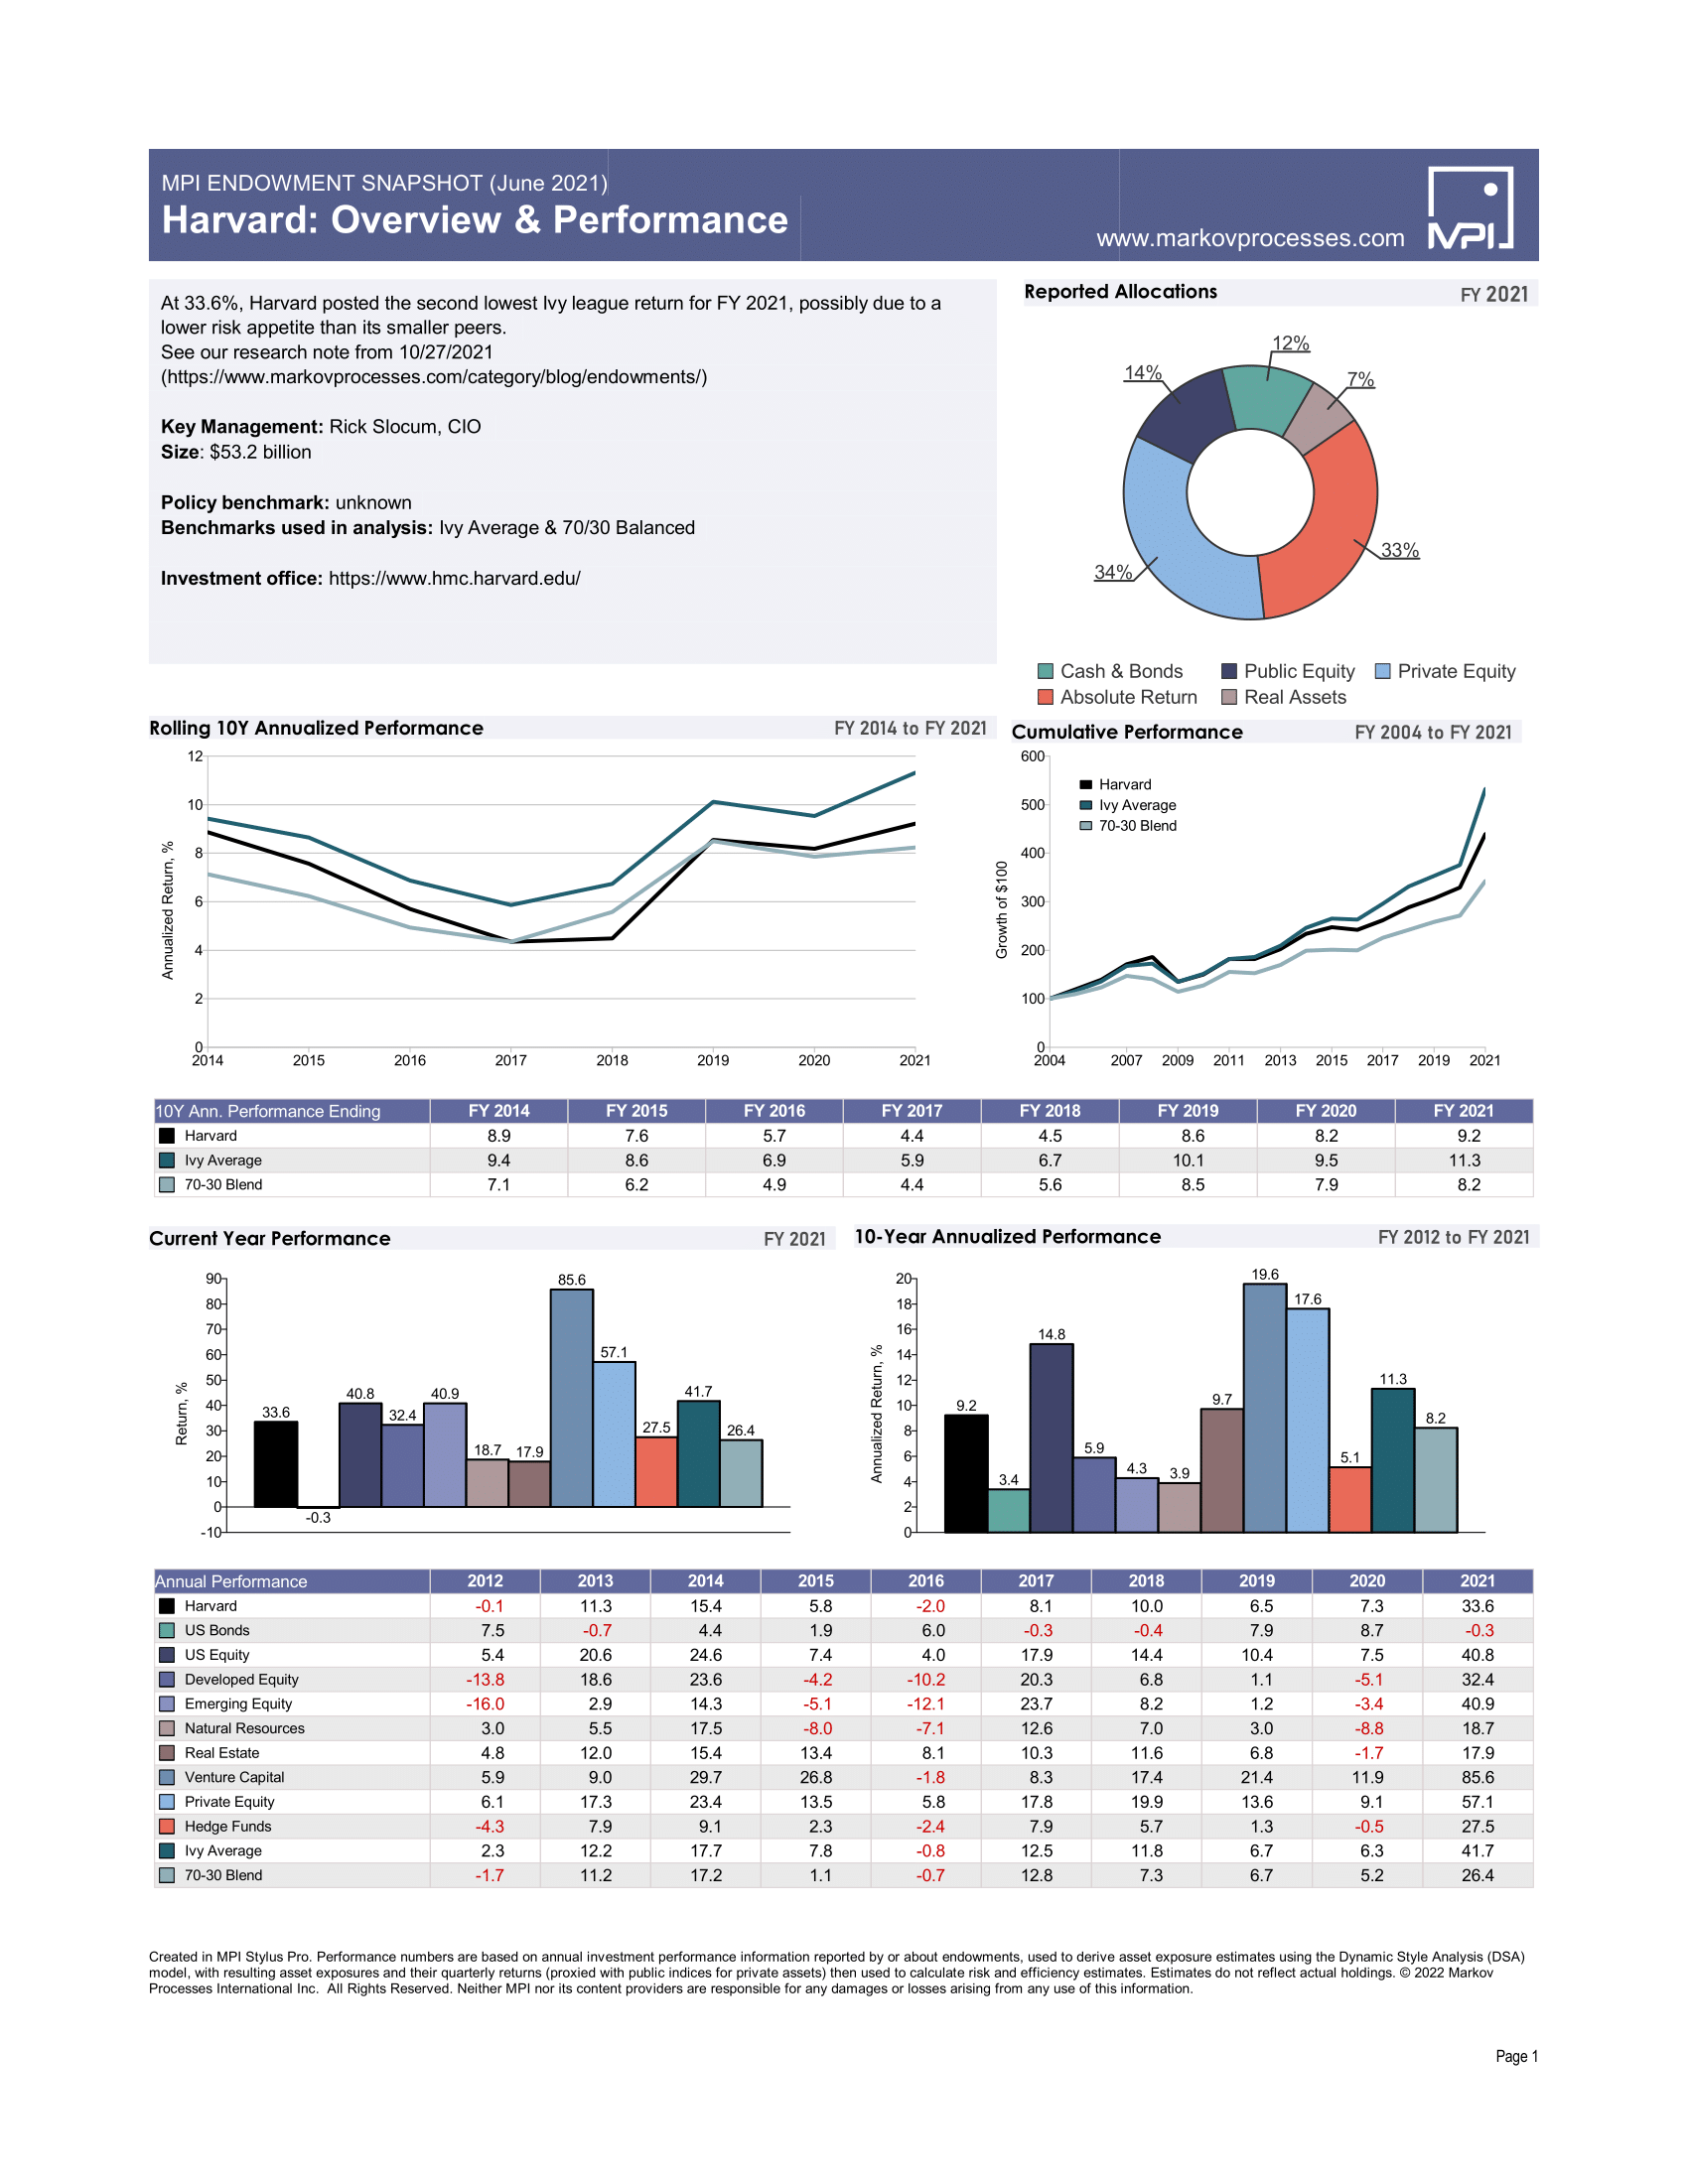
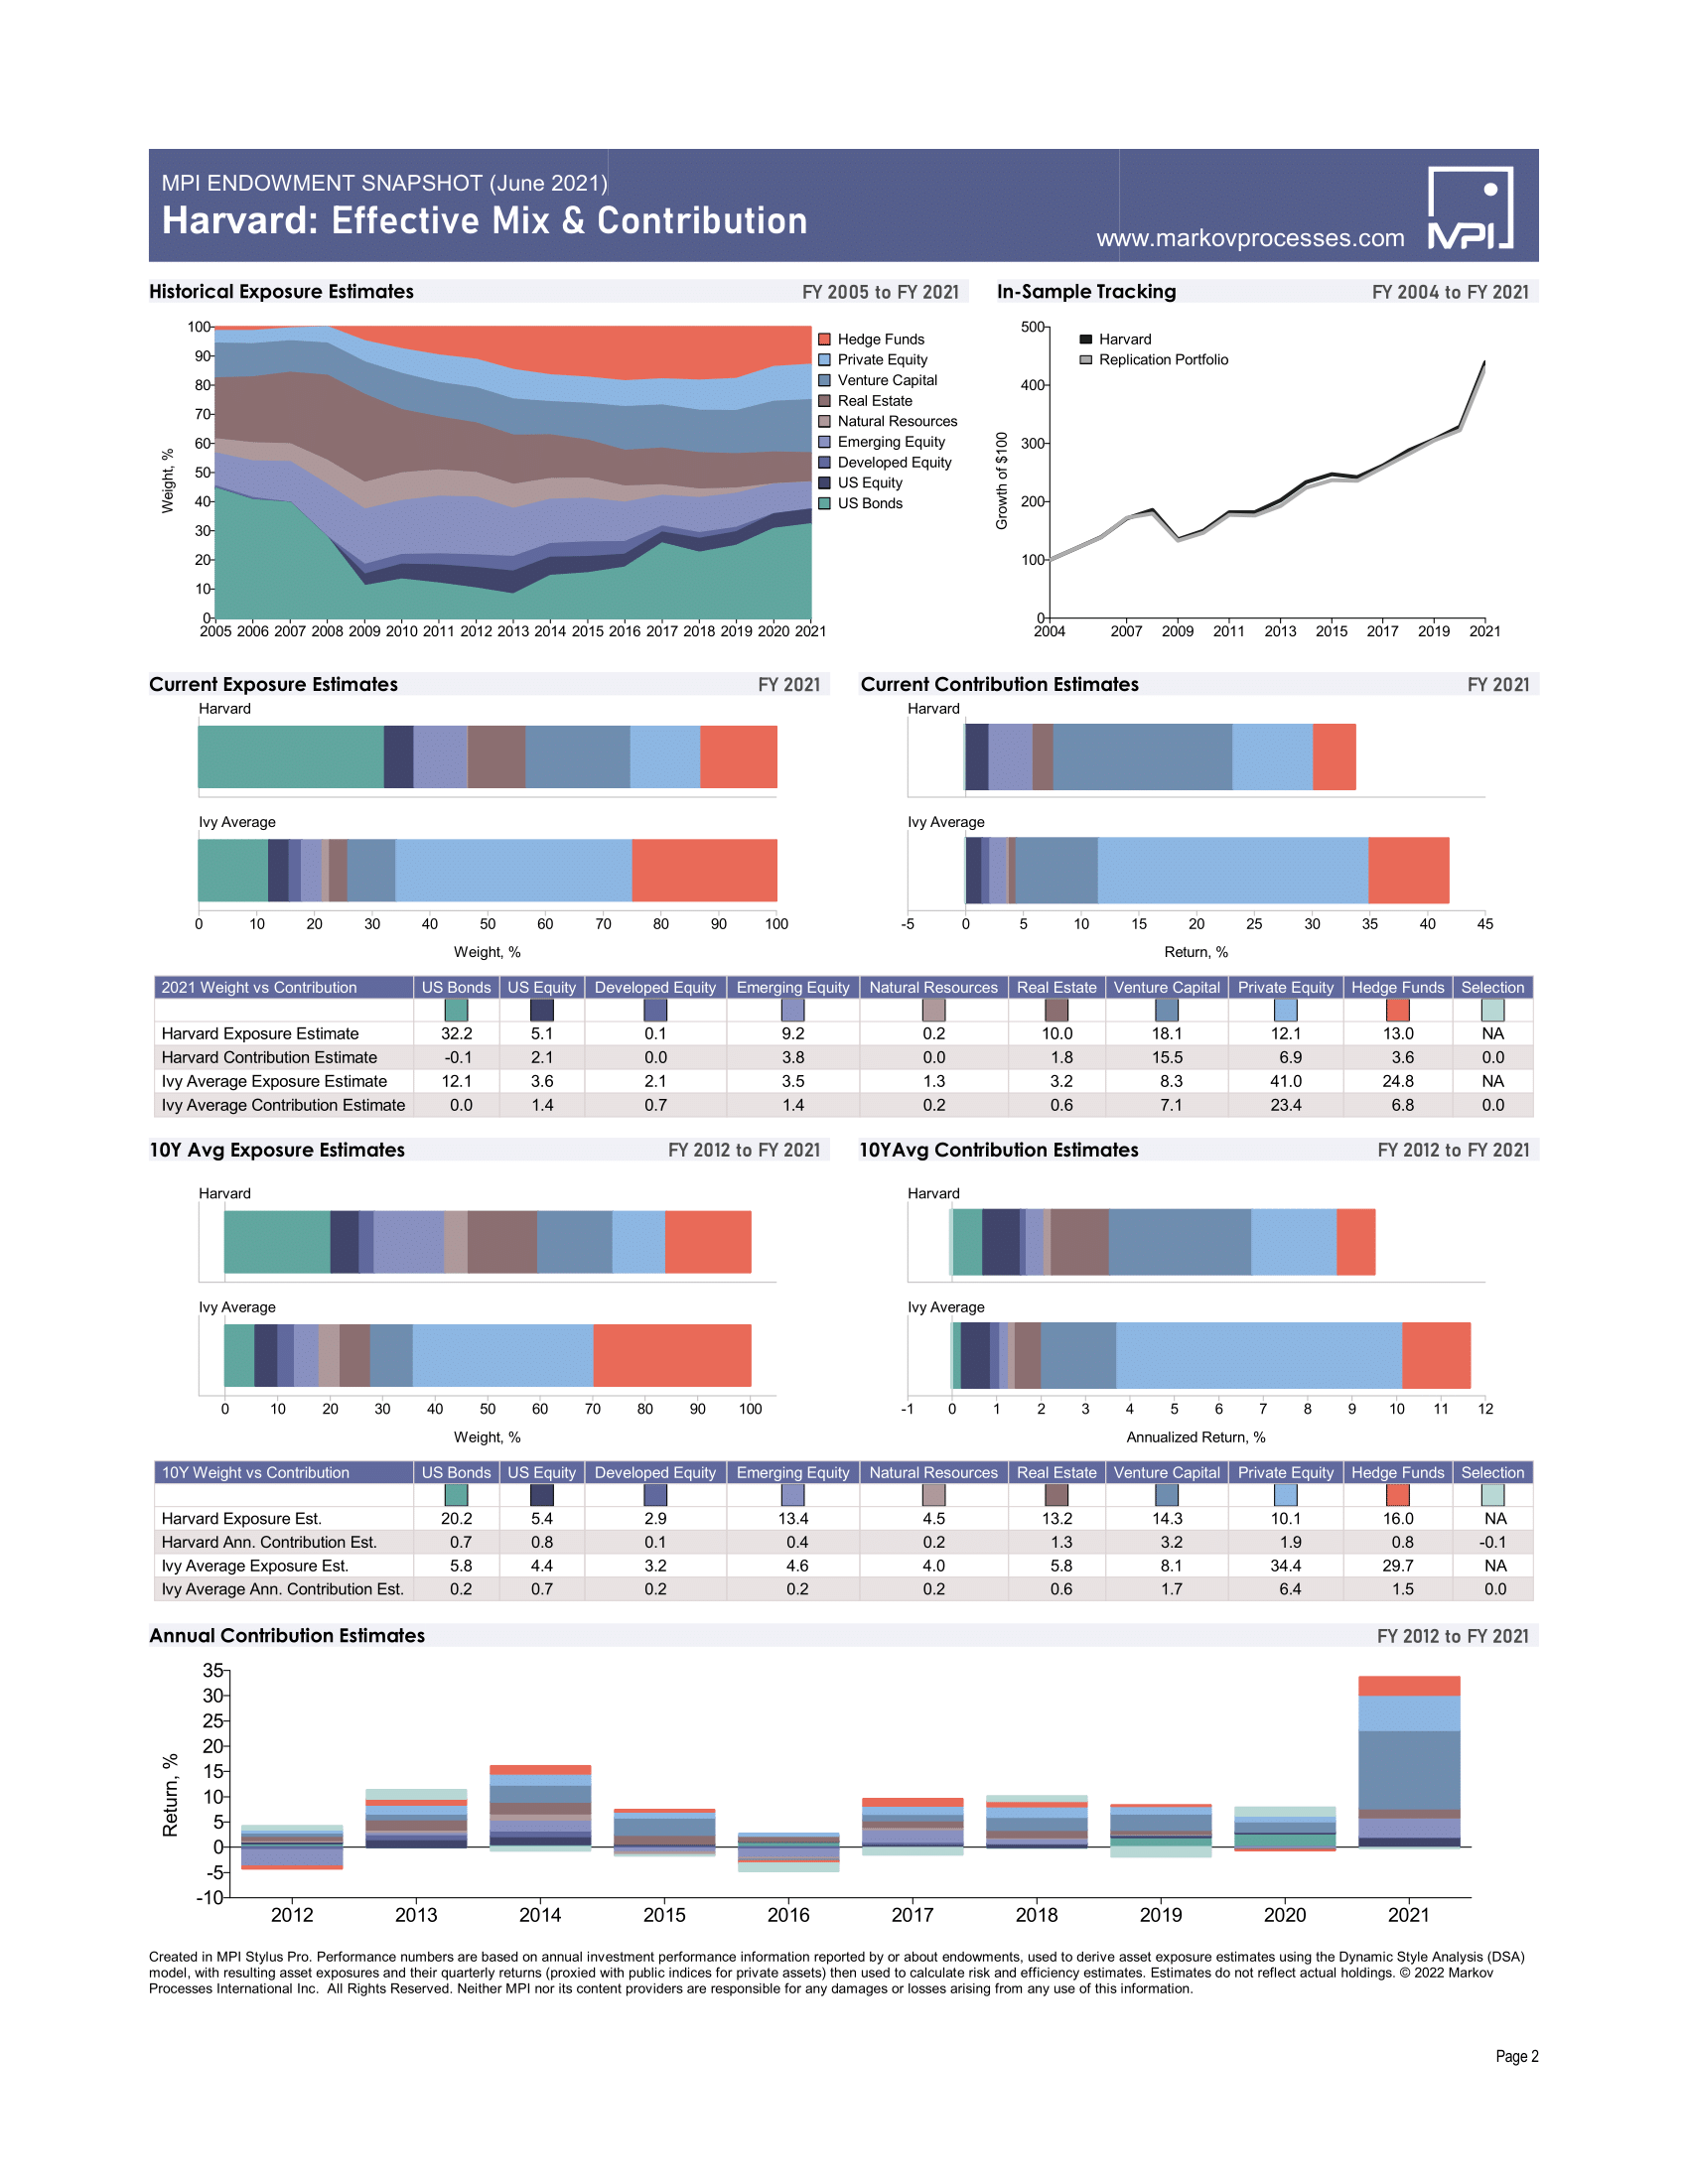
- Uncovering hidden allocation trends. Harvard’s restructuring after the global financial crisis, Brown’s big bet on tech, Duke’s dive into crypto. Our tools allow a sharper picture of flows in and out of allocation categories, helping reveal which funds’ behavior matches their PR.
- Risk and Efficiency. Endowment and pension press often focuses on returns and ignores the risk and performance efficiency analysis every investment needs. Large endowments are long-horizon investors that lack the constraints of regulated investments. And underfunded pensions could be in danger of chasing returns through high-risk investments. MPI helps uncover an investment’s risk/return efficiency picture even with only a few public data points.
- Performance attribution. Endowments had no problem boasting about asset class contributions to returns in FY2021; after all, it was a record year. But in down years, managers may be less incentivized to explain their results to stakeholders. Our tools help stakeholders form year-to-year performance attribution pictures to keep a close eye on ongoing behavior.
- Meaningful investment rankings. Most public lists focus on pure performance from year to year. But MPI’s inclusion of risk and efficiency metrics helps tell more meaningful stories, shining a light, for example, on smaller endowments and pensions that are more efficient than their larger and more prominent peers.
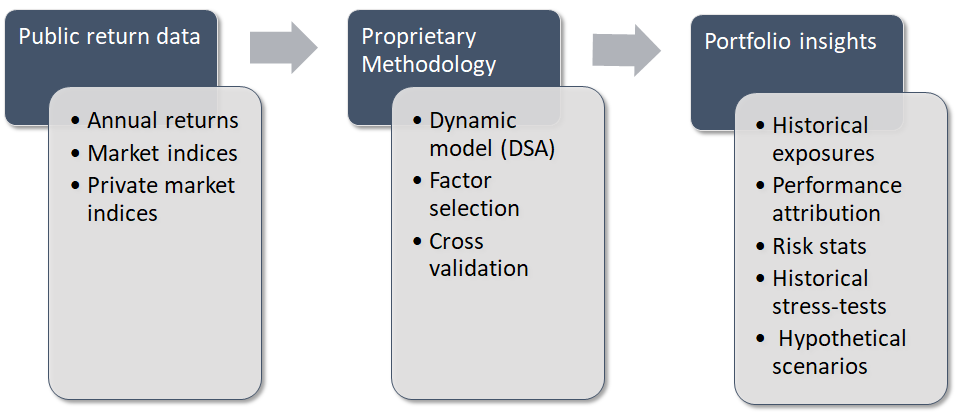
3. Methodology
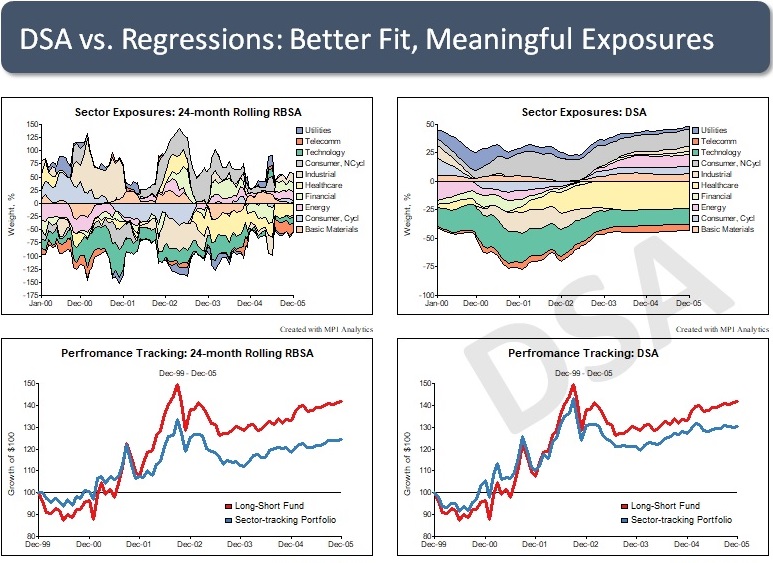
When only annual performance figures are reported, a decade’s worth of performance is represented by 10 data points. Traditional static and rolling window methods of regression analysis struggle to find credible insights from such infrequent data. MPI’s Dynamic Style Analysis (DSA), however, is uniquely able to work with such limited data.
DSA improves upon Sharpe’s original returns-based style analysis (RBSA) approach and, using factors indicative of the asset classes deployed by pensions and endowments, provides significant insights into their behavior. With our DSA, MPI is able to explain changes in an institution’s performance over time and to highlight differences across institutional portfolios using a common analytical framework.
MPI’s Dynamic Style Analysis (DSA) Methodology
- Uses publicly available annual returns and public and private market indices/factors.
- Captures changing portfolio exposures in ways other methodologies can’t.
- Cross-validates selected factors and model parameters through rigorous machine-learning algorithms.
- Computes estimated return contributions by asset both for the most recent fiscal year and the entire history.
- Computes risk measures, drawdowns, stress tests and hypothetical shocks using quarterly public proxies and the most recent factor exposures.
For a much deeper dive into the MPI approach and our proprietary methodology, see this CAIA-published paper.
4. MPI-360 Reports
The takeaways from pension and endowment transparency reports found in this Hub are not much different from the ones that MPI clients derive on a daily basis when using our tools to analyze and compare individual mutual funds, hedge funds, PE and VC funds as well as portfolios of funds.
Individual MPI fund reports
- Uncover trends in asset allocation and exposures.
- Explain more recent and historical results and compare them to benchmarks and peers.
- Provide estimates of risks, drawdowns and efficiency
- Calculate historical stress-tests and hypothetical scenarios
For a selection of many more reports, go to MPI Endowment Tracker and Pension Tracker.
Asset class exposures in our analysis represent what Prof. William Sharpe called an “effective mix” or what traders usually call “beta-adjusted exposures.” In a multi-manager, multi-strategy, and multi-asset portfolio, both equity and fixed income exposures can be affected (“netted”) by short positions, leverage and derivatives. In addition, overweight in high-beta, more aggressive strategies could result in a higher exposure to the market represented by a generic index such as the S&P 500. And, alternatively, overweight of low beta, value-focused strategies could cause effective equity exposure to be lower.
As a result, exposures obtained through factor analysis of returns may not match reported asset allocation but could provide more accurate information for both risk managers and CIOs as the effective exposures rather than the reported ones are, in fact, driving returns.
We create public market proxies to model private market returns. When we use these proxies for risk calculation, we’re not smoothing them and, therefore, they provide risk assessment as if private investments were marked to market instantaneously. It’s worth mentioning that risk estimates depend significantly on whether the estimation window includes the Financial Crisis of 2008-2009 when real estate in particular experienced a major correction in both public and private markets.
In a multibillion dollar portfolio with dozens of managers, individual specific risk is mostly diversified away. Therefore, it’s mostly about precision of the factor model and its ability to explain composite returns rather than individual manager skill.
By definition, “Selection” is a portion of return that is not explained by our factor model. Selection might include fees, missing or imprecise factor effects, rapid changes in allocation that cannot be captured by annual data, massive write-offs or restructuring, individual success stories such as the Coinbase investment by Duke, etc. Fortunately, multibillion dollar portfolios are not easily turned over quickly, especially when significant portions are in illiquid private investments, and this makes our analyses possible and more accurate. Nevertheless, many try to see manager selection skill behind some endowment success stories. In most cases, such success is driven by a common factor we can identify. For example, we determined overweight of technology as the primary source of the Brown endowment’s winning streak.
Indeed, annual data, the only public disclosure most institutions provide, results in very small samples. Quarterly or monthly data, if available, would allow more accurate and even more granular (more factors) results. But we squeeze the most insight possible out of available data, always with a firm eye on its validity. We use machine learning techniques, including cross-validation, to calibrate our DSA model to make sure it’s not a simple data fitting exercise. These techniques are analogues to out-of-sample replication where past data with a lag is used to project next-period returns, but much more computation intensive.
As mentioned above, asset class exposures obtained through our analyses may differ from stated allocations but, if used to replicate an institution’s results out-of-sample, would deliver very close returns.
Solutions
Latest Research
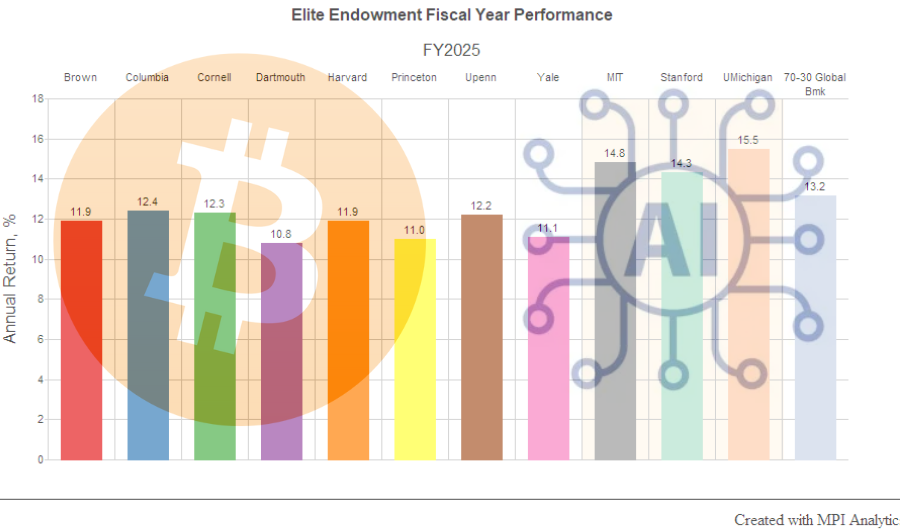
FY25 Endowments: AI and Crypto to the Moon
We analyze annual endowment returns to offer a plausible explanation for MIT, Stanford, and Michigan’s spectacular FY25 results. The evidence points to AI and digital-asset themes....
Elite U.S. Endowments: Government Funding and Liquidity Pressure
Federal funding cuts could impose significant financial strain on elite universities. One key factor in determining a university’s resilience to such funding disruptions is the liquidity of its endowment....
MIT’s Risky Business
Reading the President’s warning through the lens of liquidity vs. market risk...
MSTR (Strategy) Beauty Pageant – Premium to Bitcoin
Our Stylus Pro system is normally used by large multi strat hedge funds to x-ray traders’ P&L. Here we decided to x-ray the daily stock price of the largest holder of Bitcoin....
Dartmouth Endowment – The Ivy League’s Switzerland of Finance
Our analysis shows how portfolio construction, pacing, and governance created a resilient “Switzerland” profile – and what others can emulate....
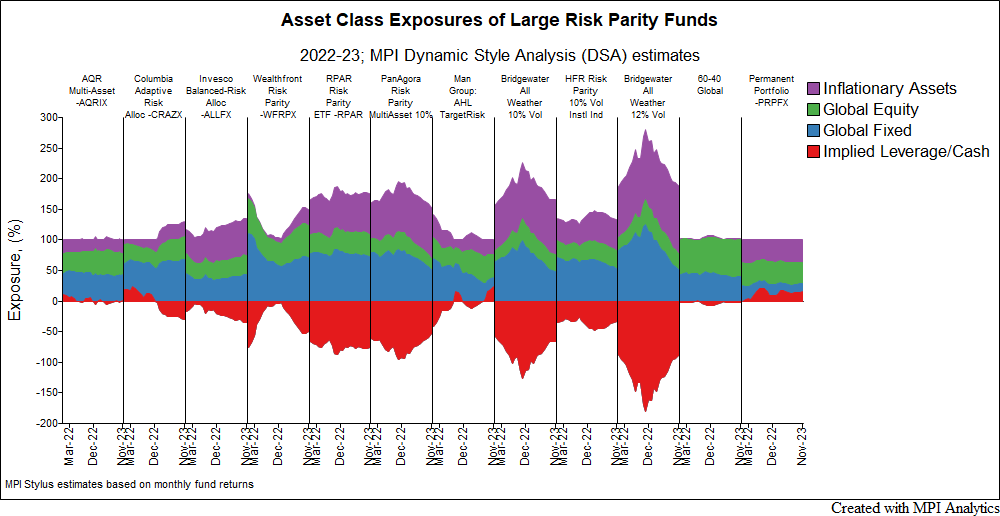
Risk Parity Not Performing? Blame The Weather.
Many high profile funds with set risk targets exhibit levels of volatility last seen only during the Global Financial Crisis. This and the disparity of results between funds in the category is the subject of this post. ...
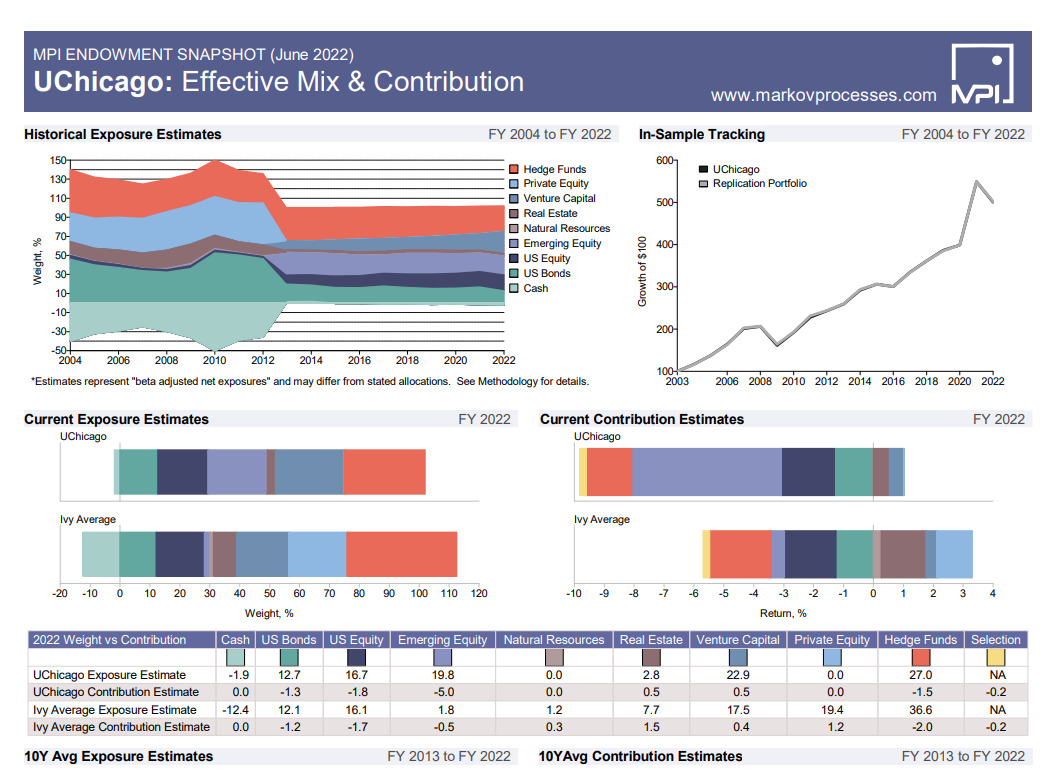
University of Chicago's Endowment FY2022 Risk Premia Story
MPI Transparency Lab Analyst Commentary...
CIO’s Winning Strategy: Strive to Be Average
For the past 20 years Texas Teachers Retirement System’s performance mimics the average of large public pensions tracked by MPI Transparency Lab....