8 Years Later: The Quest for a Perfect Hedge Fund Benchmark
Eight years ago, we partnered with Eurekahedge to develop a unique hedge fund benchmark. We review live performance of the index and its liquid tracker - MPI Eurekahedge 50 Tracker Index.
The Index of Top Hedge Funds
About eight years ago, our research team embarked on a project to create an index of elite hedge funds that faithfully captured the diversified portfolio typical of large institutional investors. Partnering with Eurekahedge, we created screening criteria to deliver a portfolio of the 50 largest hedge funds, allocated between five major strategies and reconstituted on an annual basis. The result was the Eurekahedge 50 Index (BLOOMBERG: EHFI400), a first-of-the-kind concentrated institutional quality benchmark launched in November 2014.
The index was designed to represent the typical diversified portfolio an investment team might select. But it also sought to overcome problems that plague other hedge fund benchmarks, such as strategy bias (i.e., equities) or being over-diversified, with hundreds of constituencies.
We recently wrote that some Ivy endowments, such as Brown, heavily bet on equity funds which brought them ahead of the pack for several years. However, overweighting long-short equities could have been a disaster this year. Therefore, a good index must be balanced between major strategies: equity long-short, relative value, event driven, global macro, etc.
Another issue that many hedge fund investors are trying to avoid is the investment firm concentration risk, e.g., investing in several (albeit different) strategies from the same manager. The EH50 index selection process is mitigating such risks by, for example, not allowing more than one fund per family in the selected group of 50.
Every year MPI and Eurekahedge revise the Index constituency membership based on significant changes in AUM and continuing data availability. Every fund in the Index is validated by MPI research team for style/strategy consistency to avoid potential misclassifications, data errors or significant unexplained returns. As of the latest reconstitution in November 2021, the combined AUM of funds in the index was $206 billion with an average minimum investment of $7.6 million. With 11 funds from the 50 closed to new investors and allowing mostly quarterly or annual redemptions, the index represents a group of highly desirable institutional quality funds that are “hard to get in or out.”
| Total number of hedge funds | 50 |
| #Funds closed to new investors | 11 |
| Combined AUM | $206B |
| Average min investment size, $M | $7.6M |
| Redemptions (majority) | quarterly |
| Turnover rate (at reconstitution) | 9% |
| Fees (average) | 1.7/20 |
The Tracker
On the same day we launched the EH50 index in November 2014, we also premiered its investible tracker – the MPI Eurekahedge 50 Tracker Index (BLOOMBERG: EHFI401) consisting of 25-30 liquid ETFs and priced daily by Alerian, and which was intended to serve as a benchmark for liquid alternatives such as mutual funds and ETFs. When multiple hedge funds are blended in an institutional portfolio, some bets – whether these are securities, sectors, styles, country/currency, rates, etc. – cancel out, while some are strengthened. The tracker is intended to capture such common bets of elite hedge fund managers. The tracker methodology was developed by our research team using the same techniques and the know-how that we provide to MPI’s clients – investors, consultants, and government regulators – to vet and monitor complex investment products such as hedge funds. With almost eight years of live performance of the MPI Tracker index, we have plenty of data to analyze.
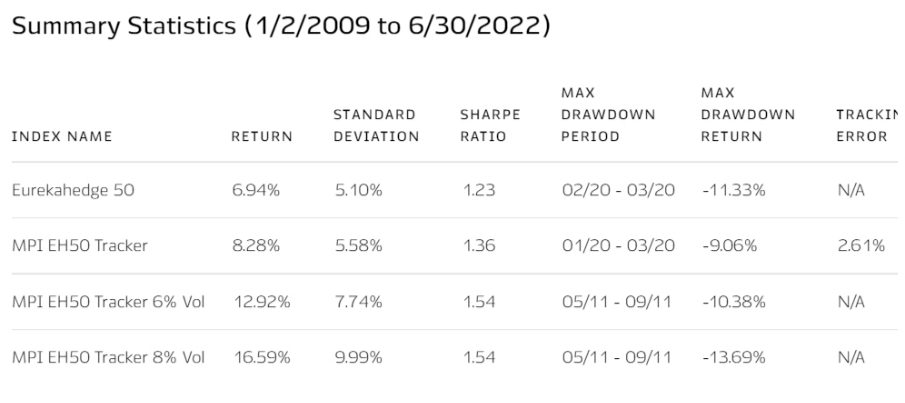
By looking at the latest statistics from MPI website we observe that the MPI Tracker has a very low tracking error of 2.6% to the Eurekahedge 50 index.
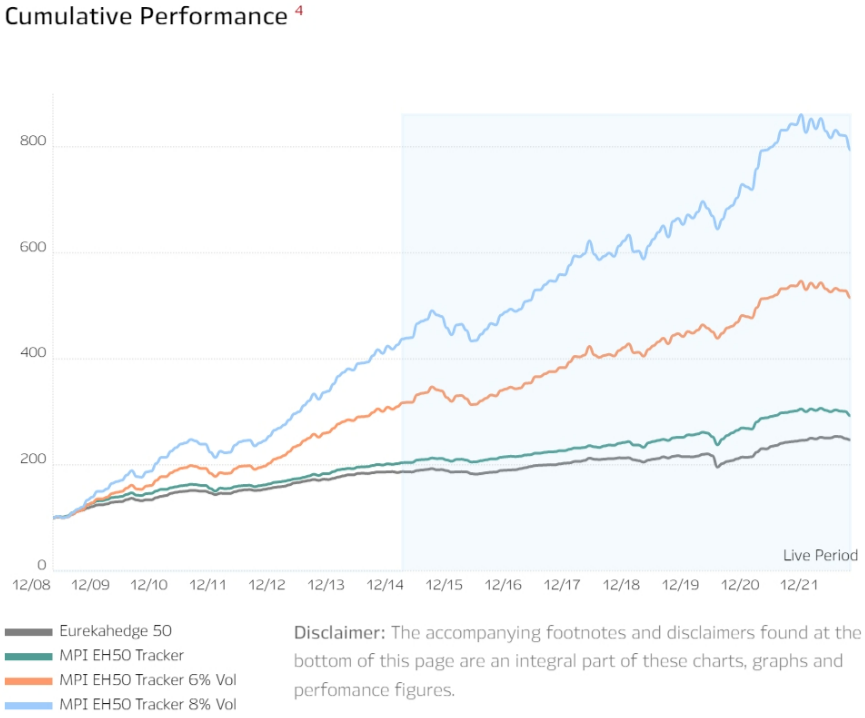
But we can also see from the chart that the liquid MPI EH50 tracker steadily outperforms the target index. There are a few reasons for this. Firstly, the tracker is intended to mimic hedge fund performance before fees using our proprietary algorithms. And secondly, the tracker is not subject to operational and redemption issues of hedge funds. Even though the Eurekahedge 50 index is going through the annual quantitative “scrub,” its constituent funds are not immune to operational risks. And while the attrition rate of the EH50 is lower than for the entire hedge fund universe, we find that 2-3 funds on average would have some performance or operational issues annually resulting either in diminished AUM, stopped reporting or even liquidation.
A Case Study
How representative is the EH50 elite hedge fund index of the individual investor performance? A good benchmark ideally should have close correlation with investor results and come somewhere in the middle performance-wise for a large representative sample. Before we attempt to conduct a wider study, we decided to compare the performance of the EH50 benchmark with hedge fund portfolios of several large prominent institutional investors that publicly provide breakdown of their annual performance by asset class. For that we extracted performance numbers from annual public reports along with the allocation and “nomenclature” – as there’s no uniformity in how pensions and endowments label and classify their hedge fund investments. All numbers represent June fiscal year results except for Texas TRS having fiscal year ending in August, but we believe that the two-month-shift impact of the cumulative chart is minimal[i]. The common period for which these investors provide performance breakdown by asset class starts in FY2013.
| Institutional Investor | Hedge Fund Allocation (FY2021) | “Nomenclature” |
| NJ PERS | $3.2B | Hedge Funds |
| Texas Teachers (TRS) | $17B | Stable Value Hedge Funds |
| Harvard Endowment | $18B | Absolute Return |
| Princeton Endowment | $8.4B | Independent Return |
In the chart below we compare performance of the four investors with that of the elite hedge fund index and the MPI tracker. It is evident from the chart that the EH50 index literally mimics the performance of both pensions’ hedge fund portfolios, making good on its original intent: to be a good measure of a large, professionally allocated hedge fund portfolio. The two Ivy endowments outperform the index while the liquid ETF tracker comes in close third.
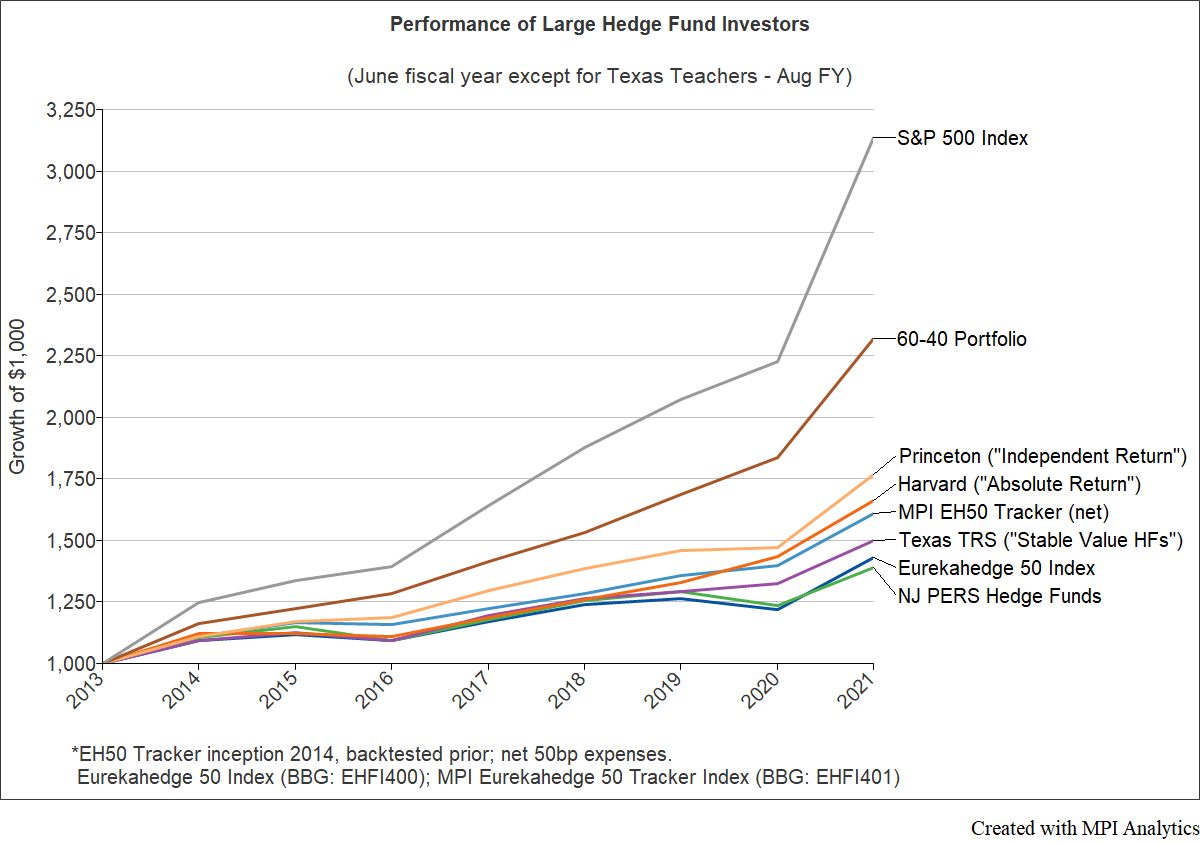
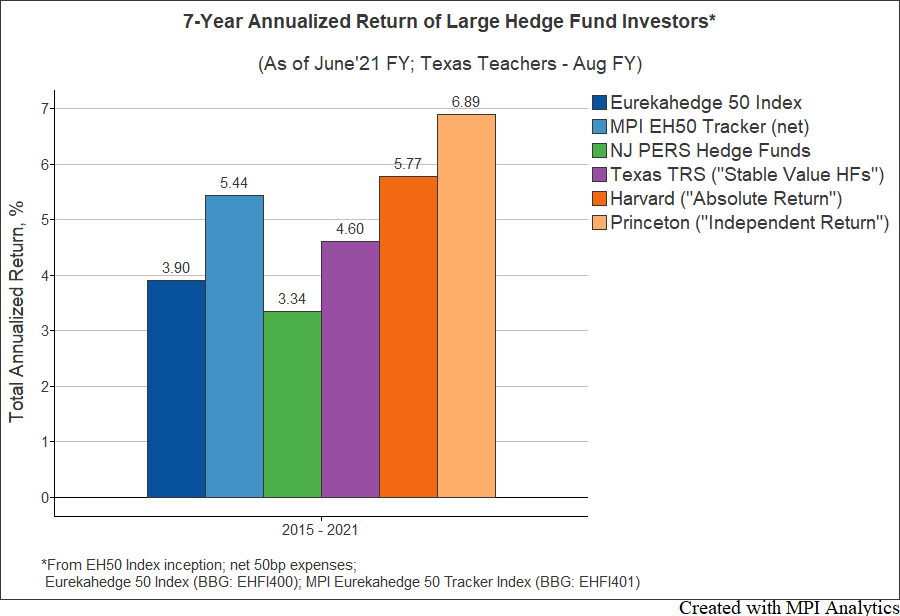
We should make a caveat that prior to November 2014 performance of both the index of hedge funds and the tracker were backtested. Below we show annualized performance over the 7-year live period from FY2015.
For example, consider the chart below. We took a $6B hedge fund allocation from a large state pension (publicly available December FY annual returns) and compared it with Euerkahedge 50 index. Because returns are computed over a different fiscal year, we couldn’t show it alongside the other funds. Similar to the chart above, the pension portfolio (darker line) literally overlaps with that of the Euerkahedge 50 benchmark, albeit with slightly lower volatility.
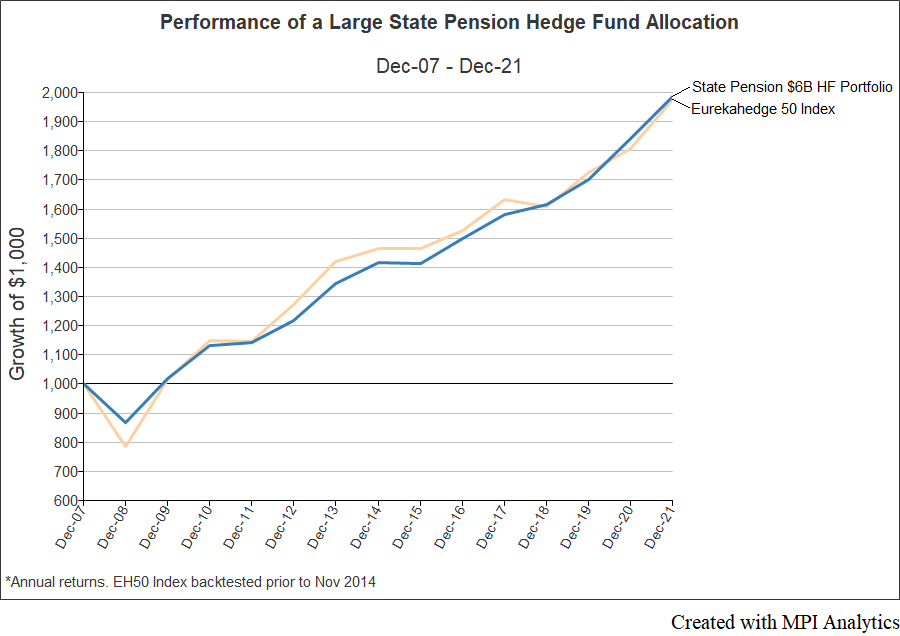
The fact that Eurekahedge 50’s track record literally coincides with that of large pensions’ hedge fund portfolios is a testament to the index construction (e.g., strategy diversification) and annual rebalancing process, which distinguish it from other benchmarks. Large endowments, however, exhibit somewhat different patterns. This could be explained by the fact that, unlike most pensions, being “infinite horizon” investors allows them to take bets on individual strategies (e.g., tech funds for Brown) or even individual funds or stocks (e.g., Coinbase for Duke).
For a more comprehensive study one would need to collect performance of institutional investors’ allocations to hedge funds and compute correlations and risk, which creates a problem given that only annual returns are publicly available, albeit with some gaps and varying fiscal year ends. However, even before we attempt to do a more exhaustive comparative study with a larger pension universe, we can already say with confidence that the EH50 index can serve as a relevant benchmark for institutions measuring their hedge fund performance.
At the same time, the MPI EH50 Tracker Index being liquid and transparent and delivering performance similar to some real-life institutional portfolios can serve as a benchmark for liquid alts mutual funds, ETFs and UCITS. And, as these complex investment strategies come with different volatility profiles, 6% and 8% Target Volatility versions of the Tracker can serve as benchmarks for a wide range of individual strategies.
Keep an eye out here for more discussions about hedge fund benchmarks in the coming weeks. In the meantime, check out additional statistics of interest from our MPI Hedge Fund indices page.
Edited:
8:40AM EST 08/17/2022 replaced chart "Performance of a Large State Pension."
The original chart contained additional benchmarks from Eurekahedge and HFR.
_______________________
[i] Harvard Endowment has decided not to provide asset allocation performance breakdown for FY2017 citing a significant restructuring that was taking place by a new CIO Narv Narvekar. We estimated 7% FY2017 performance for the Harvard hedge fund portfolio. Similarly, Princeton chose not to provide performance breakdown by asset class in FY2012 – hence, our comparison starts in FY2013.
Technology Solutions
Trusted by


