Top Hedge Fund Managers Agree on Something – And It’s Not Risk Parity

Hedge Funds Have a Place in Investor Portfolios, They’re Just Too Darn Expensive and Not Easy to Pick

December 22, 2023

Asked his key to a happy life in 2021, the recently deceased investing industry legend Charlie Munger sagely said, “The first rule of a happy life is low expectations. If you have unrealistic expectations, you’re going to be miserable all your life.”

Investors in risk parity would do well to heed this advice. And investors in hedge funds might want to absorb Munger’s wisdom, too[1].

For reasons we’ve recently discussed — including vast dispersion in performance, risk levels exceeding targets and failure to preserve capital during a period of inflation and rising rates — we think it is time for investors to manage their expectations when allocating to risk parity.

The idea pioneered by Bridgewater Associates that allocation of investor dollars based on the risk contribution of an asset class to a portfolio would somehow provide a good hedge in a market downturn hasn’t materialized – especially during the positively correlated, higher inflationary environment as of late, which it was apparently built to handle. Indeed, a standalone allocation to risk parity has likely been a source of misery for many allocators, consultants and advisors lately – though November’s bull market in most asset classes has certainly helped.

But when we consider where risk parity came from, a silver lining emerges. Yes, there’s an approach designed to deliver an all-weather performance which has been in existence for 75 years – a regular hedge fund! The main purpose of a typical hedge fund was to preserve wealth – hence the term “hedge”. And, despite all the perennial criticism, as a group, large and established hedge funds have actually delivered on that promise over market cycles.

In the chart below, we compare the risk-adjusted returns (Sharpe Ratios) of:

  1. Bridgewater All Weather 10% Volatility Fund, the flagship risk parity fund;
  2. S&P Risk Parity Index – 10% Target Volatility, a rules-based risk parity benchmark;
  3. U.S. stocks (S&P 500 Index);
  4. Bonds (Bloomberg U.S. Aggregate Bond Index);
  5. Global 60-40 (MSCI ACWI Index and the Bloomberg U.S. Agg Bond);
  6. Eurekahedge 50 Index (BLOOMBERG: EHFI400), a benchmark for institutional portfolios of large, established, illiquid, hard-to-access hedge funds diversified across five strategies[2].

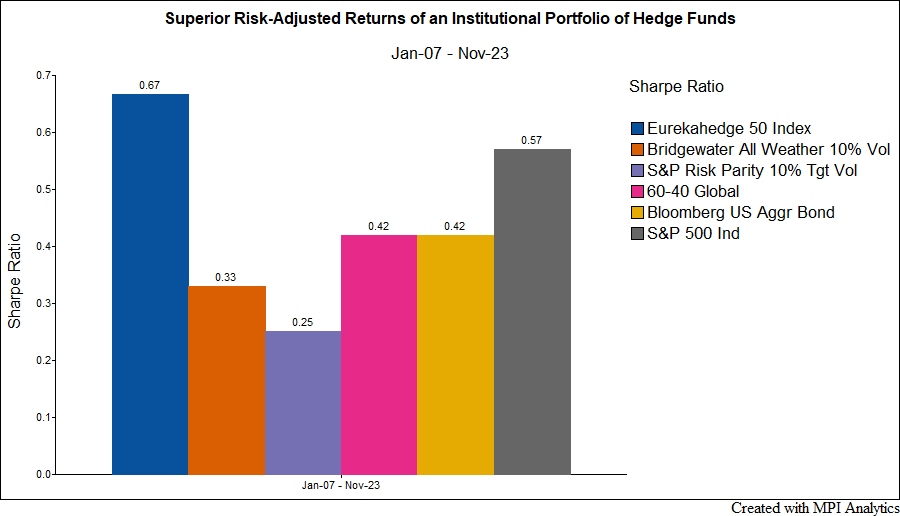
This index of the 50 largest institutional quality hedge funds rather significantly tops the others in efficiency over the past 16+ years. The collective wisdom of hedge fund managers can result in better risk-adjusted returns than the mighty 60-40.

The following two charts demonstrate that the EH50 Index is not an abstraction. It truly represents the way large, well-staffed, top-tier institutional investors allocate to hedge funds – and comes very close to, if not exceeds, the net-of-fee returns they achieve. In the chart below, we compare EH50’s performance with performance of the hedge fund portfolios of several large state pensions: Texas Teachers, Illinois Teachers, Maryland PERS, West Virgina PERS, and New Jersey PERS.[3]

In the following chart, we compare the performance of the Utah Retirement System’s $6.8B “Absolute Return” allocation with the EH50 benchmark. The pension’s fiscal year is December – unlike most pensions that report in June – that’s why it is shown in a separate chart.

To be fair, this is more than an observation that an index of hedge funds can keep pace with some of the most sophisticated and well-resourced investors in hedge funds in the world, it’s a point of pride. Exactly 9 years ago, in partnership with Eurekahedge, we launched this index of elite hedge funds representing a diversified portfolio typical of large institutional investors with access to the best, most elite managers. Working closely with Eurekahedge, we created screening criteria to deliver a portfolio of 50 of the largest hedge funds, allocated between five major strategies and reconstituted on an annual basis. The result was the Eurekahedge 50 Index (BLOOMBERG: EHFI400), a first-of-its-kind concentrated, institutional quality benchmark, launched in November 2014.[4]

So, what is special about such an index of top 50 hedge funds and why is it so efficient? Well, even the best hedge fund managers often have opposite views – that’s why we pay attention to them. These differing opinions could be on the economy, rates, sectors, styles, currencies, stocks – you name it. Such bets cancel out in a multi-manager portfolio. Investors are typically getting a low-risk portfolio where strategy-specific trades are getting diversified and common trades are strengthened, providing stable performance with low drawdowns, albeit with a muted performance relative to more growth-oriented assets, like long equities. For example, John Paulson’s historic “big short” wins would most likely have been offset by losses of other hedge funds in a multi-manager institutional portfolio during the GFC.

Large hedge fund investors, therefore, are faced with the following issue – they pay significant fees regardless of the market direction (see Paulson example above) for muted returns, not to mention operational hurdles, illiquidity and the headline risks associated with hedge fund investing. Realizing this, many pensions including CalPERS and NJ PERS among others decided to divest from hedge funds.

Having this dilemma in mind, in conjunction with designing and creating the EH50, 9 years ago we decided to use replication methods to build a family of MPI EH50 Tracker Indices. These replication indices would seek to decompose the sources of returns of this diversified portfolio of large, elite hedge funds and closely track the performance of the institutional benchmark.  Launched in 2014, the MPI EH50 Tracker Index (BLOOMBERG: EHFI401) uses liquid ETFs representing major asset classes to closely mimic the performance of the Eurekahedge 50 Index.

The outperformance of the MPI Trackers to the EH50 is worth mentioning: There are a few reasons for the excess performance of the net-of-fee return of the average, large, established hedge fund manager. Firstly, the Tracker is intended to mimic hedge fund performance before fees using our proprietary Dynamic Style Analysis method and algorithms. And secondly, the Tracker is not subject to operational and redemption issues of hedge funds. Even though the Eurekahedge 50 index is going through the annual quantitative “scrub,” its constituent funds are not immune to operational risks. And while the attrition rate of the EH50 is lower than for the entire hedge fund universe, we find that 2-3 funds on average have some performance or operational issues annually resulting either in diminished AUM, stopped reporting or even, occasionally, liquidation.

In the chart below, we compare the performance of the Tracker and its two target volatility versions (6% and 8%) to the risk-parity index from S&P and the global 60-40 benchmark. One observes that since inception, the Tracker had minimal losses whereas both a balanced portfolio and the risk-parity index lost – 2018 and 2022 in particular. In all other years, their returns were similar to both benchmarks, depending on the risk target (6% or 8%).

It’s not surprising that as the result of top hedge funds’ common focus on preservation of wealth that the volatility level of the Tracker is very stable and low. Both 6% and 8% target volatility versions of the EH50 Tracker index exhibit realized volatilities on par with their targets. At the same time, the volatility of the S&P Risk Parity 10% Target Volatility Index increased 2.5-fold: from below 10% in 2018 to 25% in November 2023 – a trend consistent with some prominent risk-parity products.

It’s not particularly surprising that the quantitative methods behind risk parity, of relying on a set of several hundred magically chosen parameters, such as predictions of short- and long-term volatilities and correlations, specific types of volatility measures, regime and leverage trigger algorithms, as well as the selection of particular types of assets and instruments, does not seem to be effective in protecting investments during times of crisis. What does prove effective is the simple idea that, as a collective, large, elite hedge funds possess knowledge and dynamically adapt to the continually changing market environment.

Investors have learned the hard way that diversifying across numerous hedge funds, or any active strategies for that matter, is not ideal due to the fees incurred for muted returns. However, an index representing distilled common hedge fund bets, targeted through accessible betas, offers the protection that risk parity promised to deliver.

EH50 embodies the collective expertise of major hedge fund managers – and the top institutional allocators to hedge funds. The Index uses proven foundational principles for constructing a well-diversified portfolio suitable for all market environments. The main drawback is the cost associated with investing in all 50 managers. This challenge prompted the creation of the investible EH50 Tracker Index suite.

While we think the late Mr. Munger was a bit harsh categorizing money managers as “fortune tellers or astrologers who are dragging money out of their clients’ accounts”, for investors who are tired of empty promises (risk parity) and expensive and onerous terms (elite hedge funds), careful manager selection and diversification coupled with advanced replication methods can bring the wisdom of hedge funds into a cheap, transparent and liquid solution.

And that sounds like more happiness and less misery; a good solution for weary investors. Perhaps it’s not so unrealistic after all.


[1] Less expectation managers will ‘shoot the lights out’ and more along the lines of portfolio diversification, preservation of capital and superior risk-adjusted returns for a smoother, steadier ride ‘up and to the right’ over market cycles.

[2] The five strategy types within EH50 are: Equity Hedge, Multi-Strategy, Equity Hedge, Event Driven, and Relative Value.

[3] NJ PERS largely divested from hedge funds several years ago and the allocation after FY2020 wasn’t meaningful. The sample of pensions was limited by the June fiscal year and data availability from www.publicplandata.org

[4] Fund selection methodology as well as monthly returns can be looked up on Eurekahedge website. The fund selection approach was backtested through 2007.


Additional Information on the Eurekahedge 50 Index:

Every year MPI and Eurekahedge revise the Index constituency membership based on significant changes in AUM and continuing data availability. Every fund in the Index is validated by MPI research team for style/strategy consistency to avoid potential misclassifications, data errors or significant unexplained returns.  As of the latest reconstitution in November 2023, the combined AUM of funds in the index was $221 billion with an average minimum investment of $5.8 million. With 10 funds from the 50 closed to new investors and allowing mostly quarterly or annual redemptions, the index represents a group of highly desirable institutional quality funds that are “hard to get in or out.”


Table 1. EH50 stats as of the last reconstitution in November 2023

Total number of hedge funds 50
#Funds closed to new investors 10
Combined AUM $221B
Average min investment size, $M $5.8M
Redemptions (majority) quarterly
Turnover rate (at reconstitution) 9%
Fees (average) 1.7/20
Tags
Comments
Leave a Reply
Fields to complete: