Before the Disclosure: Identifying SpaceX Exposure in Elite Endowments
Can annual endowment returns reveal a concentrated private-market exposure before the underlying position becomes transparent? The recent SpaceX disclosures give us an unusual opportunity to test that question.
Our interest in SpaceX started with UNC. In June, The Wall Street Journal reported that roughly 10% of the UNC System endowment was tied to SpaceX, an extraordinary concentration for a large institutional portfolio. The history behind that position was even more interesting. Former UNC-Chapel Hill Chancellor Holden Thorp subsequently described how UNC Management invested early in Founders Fund, and how around 2009–2010 Founders Fund approached UNC about directing additional money toward SpaceX. Founders Fund itself had been one of SpaceX’s earliest institutional backers, investing approximately $20 million in 2008.
What caught our attention was that UNC’s roughly 10% SpaceX exposure appears to have been largely the result of appreciation rather than an initial allocation of that magnitude. A relatively small early venture investment seems to have grown into a very large endowment exposure as SpaceX appreciated by orders of magnitude. That creates an interesting returns-based question. If the position became sufficiently large, should its valuation changes have started showing up in UNC’s annual total-fund returns? And if so, could the same approach identify SpaceX exposure at endowments where the underlying holdings were still unknown?
That question became the basis for this analysis.
Constructing a SpaceX return history
The first problem was the return series itself. SpaceX was private for virtually the entire period we wanted to analyze, so there was no conventional public-market index or continuous price history that could simply be added to an asset-allocation model. We therefore constructed a SpaceX return proxy from the company’s historical private-market valuation and price-per-share data available from Forge Global, aligning the observations with the June 30 fiscal years used by the endowments in our study. Forge’s historical data incorporates primary financing rounds as well as information from secondary private-market activity; as with any private-company price history, the observations are intermittent and should not be confused with continuously traded public-market prices.
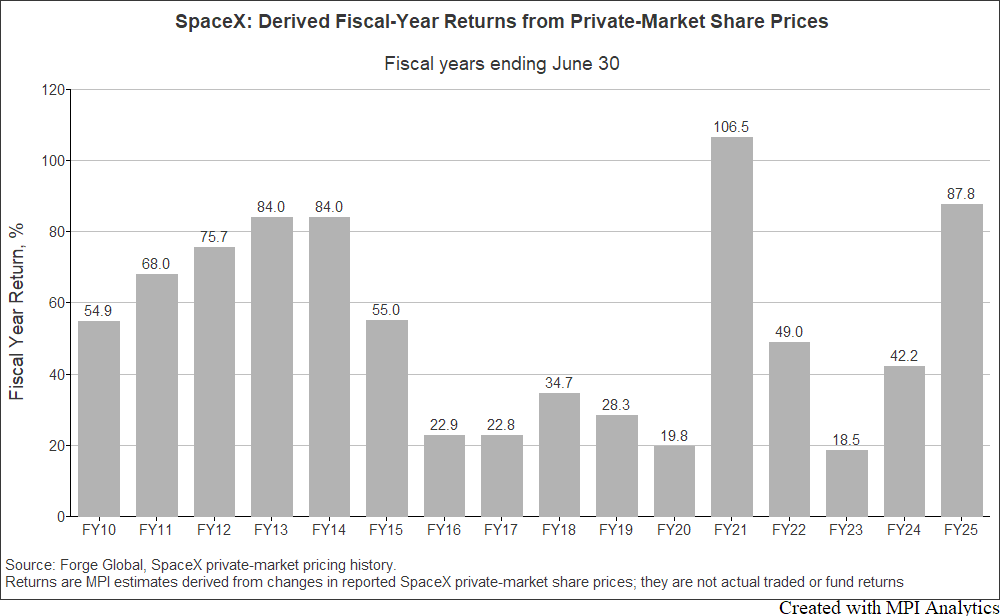
For our purposes, however, the important issue is not whether this series represents a perfectly tradable SpaceX return. We need a reasonable representation of the valuation changes experienced by investors holding the company through venture funds or directly. SpaceX is particularly well suited for such an experiment because the magnitude and timing of its valuation changes were large enough to potentially leave a detectable imprint on the return of an otherwise highly diversified institutional portfolio.
Making SpaceX explicit in the endowment model
The methodology follows the same augmented-analysis approach we used in our recent research, FY25 Endowments: AI and Crypto to the Moon. We start with the standard asset-class factors used to explain an endowment’s annual returns – public equities, private equity, venture capital, hedge funds, fixed income, real estate and other major portfolio exposures. We then introduce SpaceX as an explicit additional factor and ask whether its return pattern helps explain the endowment’s reported returns beyond what can already be explained by the conventional asset classes. This is the same logic we previously used by adding explicit AI and digital-asset factors to the standard opportunity set.
This distinction is particularly important for SpaceX because the company is already present inside many venture portfolios. WSJ reported that a number of university endowments obtained their SpaceX exposure through venture firms, including Founders Fund and other major managers. A conventional VC benchmark therefore already contains some indirect SpaceX exposure. Our estimates should consequently be interpreted as excess SpaceX exposure beyond the SpaceX exposure already embedded in an average venture portfolio, rather than estimates of direct share ownership.
This is also why we describe the results as estimated economic exposures. Annual returns cannot tell us precisely which fund owned which block of shares, the date on which an endowment acquired them, or whether shares were subsequently distributed by a VC manager. What returns can potentially tell us is whether a distinctive exposure became sufficiently important to the total portfolio to affect its observed behavior.
What happens when SpaceX is added?
The first chart below shows the augmented analysis in MPI Stylus Pro across the endowments, with SpaceX included alongside the standard asset-class factors. Most endowments do not disclose a detailed breakdown of their private-market allocations, so this returns-based analysis provides an additional view into the evolution of their estimated PE, VC and other economic exposures.
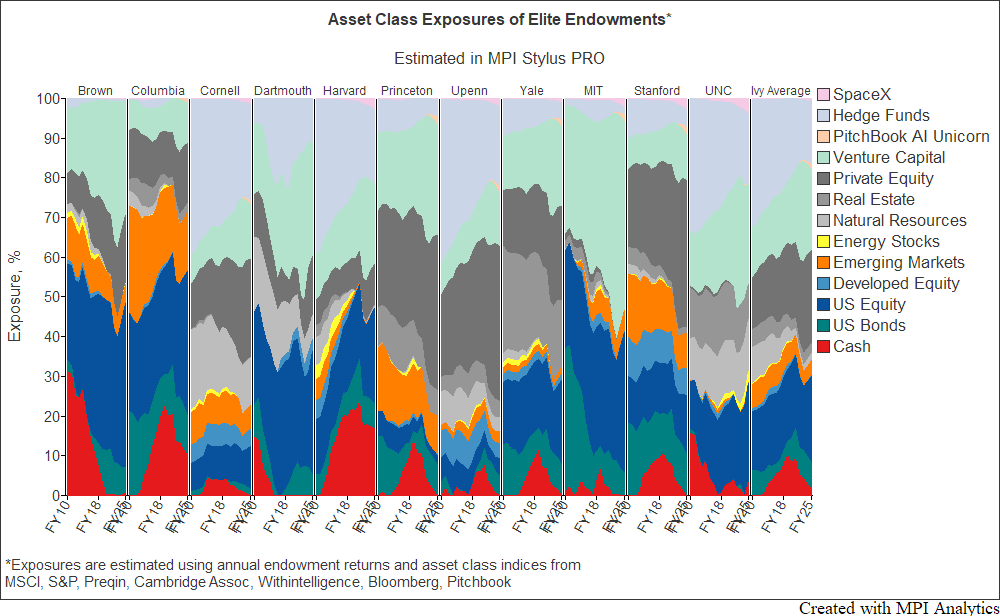
This view is important because SpaceX does not get a free pass: its return history has to compete with venture capital, private equity, public equity and the other factors for explanatory power. For many endowments, the standard asset classes do most of the work. For several, however, the model identifies meaningful incremental SpaceX exposure. That immediately raised the question of whether the results lined up with what little is publicly known about the underlying portfolios.
To see that more clearly, we isolate the SpaceX estimates and, importantly, look at how they evolve over time.
The SpaceX timeline
UNC: The Early Signal
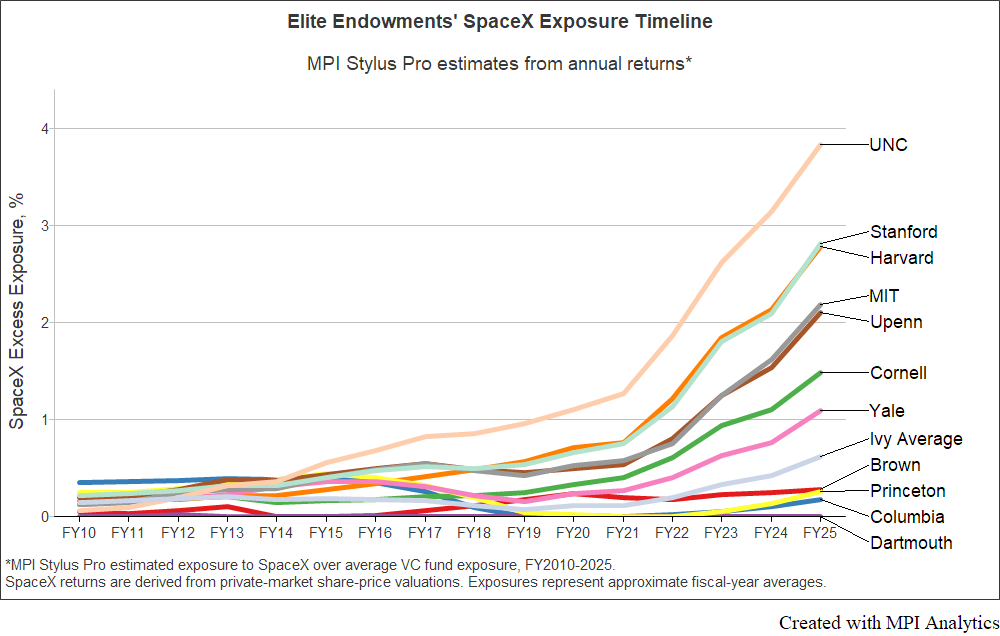
UNC immediately stands out, and not simply because it has the highest estimated exposure. The timing is distinctive. Our model starts detecting meaningful excess SpaceX exposure at UNC well before it becomes significant at the other endowments, and that exposure subsequently grows with the extraordinary appreciation of SpaceX. This is exactly the pattern one might expect from the investment history described by Holden Thorp: an early investment through Founders Fund that began small and became an increasingly consequential part of the portfolio through organic appreciation. By the time WSJ reported that SpaceX represented roughly 10% of UNC’s endowment, what had started as a venture investment had effectively become a major total-fund position.
That gave us an initial external check on the model, but Harvard provided a much more interesting one. When we first ran this analysis, Harvard’s actual SpaceX position was not publicly known. Nevertheless, the returns-based model identified Harvard as one of the elite endowments with the largest estimated excess exposure to SpaceX. Unlike UNC, however, Harvard’s estimated exposure becomes material considerably later in the timeline and accelerates in the more recent fiscal years.
Harvard: An Unexpected Validation
On August 11, we published the analysis on LinkedIn. Three days later, Bloomberg reported that Harvard Management Company had disclosed a $2.2 billion SpaceX stake in its June 30 13F filing, making SpaceX the largest single stock position reported by the endowment. The filing tells us the size of Harvard’s position as of June 30 but does not tell us when Harvard acquired the shares. We therefore cannot use the filing to validate the historical exposure path or infer actual purchase dates. It does, however, provide a rather striking validation of the basic signal: before seeing Harvard’s holdings, annual endowment returns had identified Harvard as having unusually large SpaceX exposure.
Stanford: The Open Question
Stanford provides another interesting case. WSJ reported before the IPO that Stanford held SpaceX through several venture-capital relationships, so the existence of exposure is not particularly controversial. What remains unknown is its magnitude. Our model shows Stanford’s excess exposure growing substantially and eventually approaching Harvard’s estimated level. Future holdings information, fund distributions or other disclosures could therefore provide another useful test of the returns-based estimates.
Cornell: An Intriguing Signal
Cornell presents another intriguing case. Our model shows a smaller but steadily increasing SpaceX signal, reaching roughly 1.5% by FY25. We have not found a public disclosure confirming a Cornell endowment position, but there are notable Cornell connections to two important SpaceX investors. Scott Nolan, a Cornell engineering alumnus, was an early SpaceX employee before becoming a partner at Founders Fund, one of SpaceX’s earliest institutional investors; Founders Fund invested approximately $20 million in SpaceX in 2008. Doug Leone ’79, another Cornell engineering alumnus and longtime supporter of the university, led Sequoia Capital for decades. Sequoia began backing SpaceX in 2020. These connections do not establish how or whether the Cornell endowment obtained its SpaceX exposure, but they make the returns-based signal particularly interesting and potentially testable against future disclosures.
MIT: A Plausible Manager Path
MIT presents an even more interesting timeline. Unlike UNC, where the estimated SpaceX exposure appears relatively early, MIT’s signal becomes more meaningful around FY20–FY21. This is notable because MITIMCo had a documented long-term investment relationship with Sequoia Capital by at least 2018, before Sequoia began backing SpaceX in 2020. MITIMCo also has a documented relationship with Andreessen Horowitz: in a 2024 interview, MITIMCo investor Ryan Akkina was described as having invested with Sequoia, a16z and several other leading venture managers. Andreessen Horowitz was subsequently among the investors in SpaceX’s 2023 financing round. These relationships do not establish the specific funds through which MIT obtained SpaceX exposure, but the chronology provides a plausible explanation for the later emergence and subsequent growth of the SpaceX signal in MIT’s annual returns.
FY26: The Next Test
SpaceX’s extraordinary FY26 appreciation provides another way to test the economic significance of the estimated exposures. Using Forge Global’s June 20, 2025 private-market price of $224.82, adjusted for SpaceX’s subsequent 5-for-1 stock split, and the June 30, 2026 public-market close of $170.86, we estimate an FY26 SpaceX return of approximately 280%.
Using our FY25 estimated excess SpaceX exposures as starting points, the potential FY26 contribution is substantial. A 3.8% excess exposure at UNC multiplied by the roughly 280% SpaceX return implies approximately 10.6 percentage points of contribution. The same simple calculation produces about 7.8 points for Harvard and Stanford, 6.2 points for MIT and 4.2 points for Cornell.
This provides an interesting check against the results already being reported. Bloomberg reported that UNC’s early SpaceX investment helped drive its FY26 return to more than 30%; Wilshire data cited in the same report showed returns at large funds ranging from 14.5% to 20.5%. An estimated 10.6 percentage-point SpaceX contribution could therefore explain a substantial portion of the gap between UNC’s exceptional result and the broader large-fund range. Put differently, if UNC otherwise had earned something around 19–20%, the excess SpaceX exposure could have increased the resulting total return by roughly 50%.
These calculations are not forecasts. Exposures may have changed during FY26, institutions may have sold or distributed shares, and some SpaceX exposure is already embedded in the venture-capital factor. In fact, UNC reportedly sold about $1 billion of SpaceX before the IPO, which makes a static-exposure calculation particularly approximate. But the exercise provides a useful directional framework for evaluating Harvard, Stanford, MIT and other endowments as their FY26 results become available.
Why the timeline matters
The Harvard disclosure is interesting by itself, but for us the more important result is the difference between the UNC and Harvard timelines. If we looked only at FY25, both institutions would appear to have meaningful SpaceX exposure. Looking at the historical estimates tells a richer story. UNC’s signal appears much earlier and builds gradually, consistent with a small early investment becoming enormous through appreciation. Harvard’s exposure becomes economically important much later. We cannot say from annual returns exactly when Harvard bought SpaceX or through which vehicles, but we can observe when SpaceX-like return behavior begins to matter to the total fund.
That may be one of the more useful applications of returns-based analysis to private markets. Holdings disclosure is necessarily backward-looking: one learns about an investment after the portfolio or manager reveals it. Our MPI Transparency Lab takes a different approach. We use the behavior of the total portfolio to ask what economic exposures are required to explain its results, even when the underlying managers and holdings remain largely opaque. As we showed previously with Duke’s pre-IPO Coinbase exposure and more recently in our analysis of Princeton’s declining returns, annual returns contain more information about the underlying portfolio than one might assume.
SpaceX gives us an unusually clean demonstration. UNC was the trigger and provides a documented example of a small early investment growing into a major portfolio exposure. Harvard is the validation: a very large position independently identified from returns before the holding became visible. Stanford offers another test, while MIT, Cornell and the other endowments provide hypotheses that future disclosures may either confirm or reject.
The broader question is not whether returns-based analysis can reconstruct a private portfolio security by security – it cannot. The question is whether a concentrated private-market exposure can become large enough to reveal itself through the return stream before the portfolio itself becomes transparent. SpaceX suggests that, in some cases, the answer may be yes.
Related research
- Princeton’s declining returns: an equity hedge story
- FY25 Endowments: AI and Crypto to the Moon
- Duke Endowment to the Moon
- Western Asset / Leech: What Return-Based Surveillance Could See
MPI’s technology helps institutional investors, consultants and research teams identify hidden economic exposures across private equity, venture capital, hedge funds and other opaque investments.
Technology Solutions
Trusted by