Princeton’s declining returns: an equity hedge story
Princeton’s experience shows how hedges and changing exposures can reshape an alternative-heavy portfolio. MPI’s returns-based analysis highlights why asset owners need to look beyond allocation labels to total-portfolio behavior.
Related research
- FY25 Endowments: AI and Crypto to the Moon — How hidden AI/crypto themes can be detected in “traditional” portfolios.
- Elite U.S. Endowments: Government Funding and Liquidity Pressure
- Dartmouth Endowment – The Ivy League’s Switzerland of Finance
- Solving the Biggest Puzzle of the 2024 Endowment Season
- Multiple Shades of “Green”: UPenn’s Cash Flow Dilemma
- MIT’s Risky Business
What we found
- Princeton’s allocation labels did not explain its return pattern. The portfolio behaved as if it had far less U.S. equity exposure than the reported mix would suggest.
- The disclosed equity hedge appears central to the story. Its impact becomes visible only when private assets, public assets, hedge funds, and overlays are analyzed together.
- Princeton seems to have missed much of the U.S. equity rally. MPI’s returns-based attribution suggests very limited effective U.S. equity exposure during a period when that exposure mattered.
- Private equity beta was not stable. MPI’s Dynamic Desmoothing Technique suggests PE beta declined sharply after the FY2021 peak, reducing the equity sensitivity of Princeton’s dominant asset class.
- The broader lesson: in alternative-heavy portfolios, exposures are not allocations.
More than a year ago, MPI Transparency Lab flagged a striking result: Princeton posted the lowest FY24 return in our Ivy+ peer set – 3.9% versus an 8.3% Ivy average.
The weak result was not simply a matter of private equity or venture capital. Using MPI Stylus Pro on Princeton’s published annual endowment returns, our returns-based attribution suggested something more unusual: the portfolio had very limited effective U.S. equity exposure.
Contribution by asset class to total return for each Ivy+ endowment and a 70/30 global benchmark, based on asset-class exposures estimated in MPI Stylus Pro from published annual endowment returns (FY24). Princeton has the lowest return in the group and is the only endowment with no U.S. equity contribution in the attribution.
When we then reviewed Princeton’s own disclosures, we found language suggesting that PRINCO had built a meaningful equity-market hedge over roughly 2019–2022. In the FY2022 Report of the Treasurer, PRINCO described a “significant equity market hedge” that it had “established and amplified” as a defensive response to high U.S. equity valuations and elevated effective equity beta. The hedge was implemented primarily via equity index shorts (including NASDAQ futures) and later restructured to include put options, in part to reduce “melt-up” liquidity risk.
That interpretation is also consistent with Bloomberg’s October 2023 reporting: Andrew Golden attributed Princeton’s FY2023 loss partly to poor venture-capital performance, compounded by an attempted hedge. MPI’s FY2023 Ivy Report Card similarly found both a negative venture-capital contribution and little to no effective U.S. equity exposure. The second point is the key portfolio-level issue: by FY2024, returns-based attribution suggested Princeton’s effective equity exposure was already far lower than the headline allocation labels implied. In other words, the hedge may have been disclosed, but its impact only becomes clear when the full portfolio is analyzed top-down, after private assets, public assets, hedge funds, and overlays all net out.
Roll forward one year and the same structural issue—near-zero effective exposure to the U.S. equity rally—helps explain why Princeton finished last among Ivy+ peers in FY25. This shift also shows up in longer-horizon optics: after ranking near the top of the peer group on rolling 10-year performance for much of FY15–FY22 (occasionally second only to MIT), Princeton’s rolling 10-year return fell to below the Ivy average by FY25.
Download: Princeton MPI360 report (via the MPI Transparency Lab).
The issue has become consequential enough that Princeton has publicly reset expectations. In a February 2, 2026 letter, President Christopher Eisgruber noted that PRINCO had lowered its long-term expected endowment return to 8.0%, down from 10.2% only three years earlier, citing more limited opportunities in illiquid assets and lower expected future returns. That public explanation focused largely on private-market opportunity sets; it did not address the role of the equity hedge or the portfolio’s effective exposure to the U.S. equity rally.
Why asset owners need holistic top-down analysis
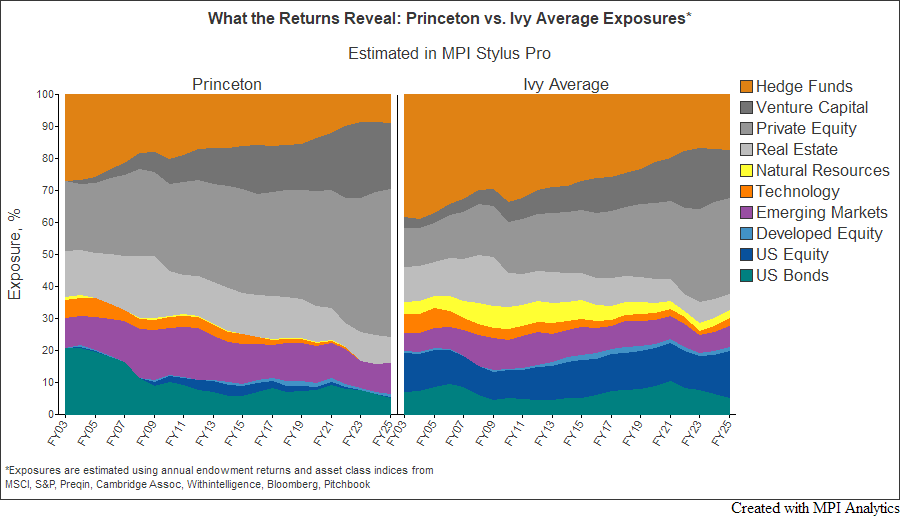
The attribution results above are derived from MPI-estimated asset-class exposures using annual endowment returns, rather than disclosed policy allocations.[1] That distinction matters. PRINCO’s own rationale for the equity hedge referred to a portfolio with a “bias toward equities or equity-like assets,” noting that 94% of the portfolio was allocated to such investments. But a holistic returns-based analysis tells a more nuanced story: Princeton appears to have had little or no effective U.S. equity exposure even before FY2019.
The chart below compares Princeton’s estimated exposure dynamics with the average of the eight Ivy institutions (including Princeton). While the Ivy average shows a meaningful U.S. equity loading, Princeton’s public-equity exposure appears to have come primarily through emerging-market equities. The chart also shows a small U.S. equity exposure that disappears around FY2019, consistent with PRINCO’s public disclosures about establishing and amplifying an equity hedge.
This is precisely why institutional investors need total-portfolio, returns-based analysis—not just sleeve-level reporting. In alternative-heavy portfolios, exposures can net out in unexpected ways. Hedge funds, private equity, public equity, and overlays may either offset one another, as appears to have happened at Princeton, or unintentionally reinforce the same risk. Private equity beta, leverage, and valuation lags also change over time, so the economic exposure of a 40% private-equity allocation is not static. In Princeton’s case, the combined effect appears to have been a portfolio that missed much of the U.S. equity rally while still carrying substantial illiquid, equity-like risk.
MPI Transparency Lab and MPI Stylus Pro help asset owners analyze realized exposures, private-market beta, and total-portfolio behavior and risk beyond allocation labels.
Why private equity could not offset the hedge
In FY21, Princeton reported a 98.7% return for its private-equity sleeve, helping drive a record 46.7% total endowment return. The private-equity allocation rose to 41.9%, well above its 30% target. By FY25, the reported allocation remained roughly unchanged at about 41%.
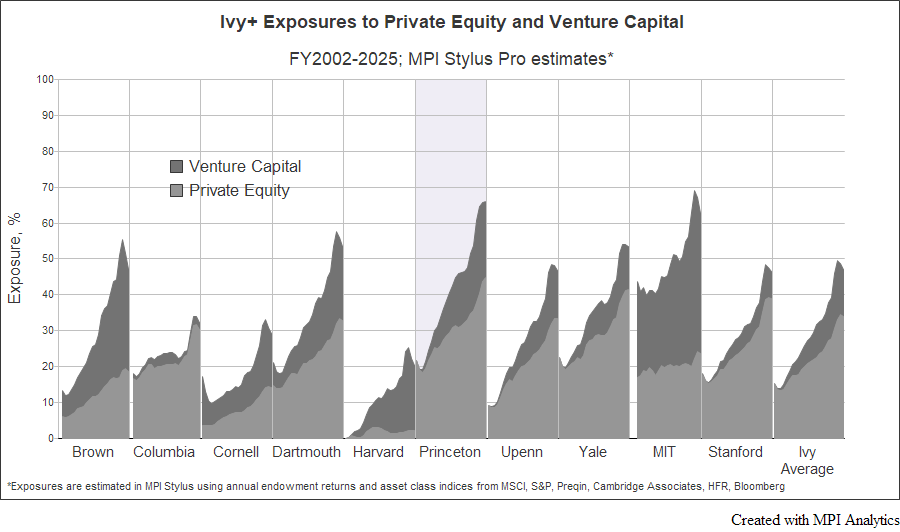
But reported allocation is not the same as economic exposure. MPI’s returns-based analysis of PRINCO’s annual returns suggests that Princeton’s effective PE/VC exposure was above 60% — higher than its reported allocation and the highest among the Ivy institutions, second only to MIT in MPI Transparency Lab’s Ivy+ cohort.
Since the private-equity exposures below are measured against a generic diversified index — Cambridge Associates U.S. PE/VC indices in our study — this could mean that Princeton’s actual allocation carried higher risk/beta than the broad index of 800+ funds.
PRINCO was right to treat private equity as part of the portfolio’s 94% equity-like exposure. Private equity is indeed equity and, in many cases, behaves like levered equity – both directly, as with many buyout strategies and indirectly – through venture capital optionality. However, this leverage/beta is difficult to see in smoothed (often with mark-ups and mark-downs) and lagged appraisals of private companies resulting in both autocorrelated returns and idiosyncratic noise. Once such noise is filtered out, an interesting pattern emerges.
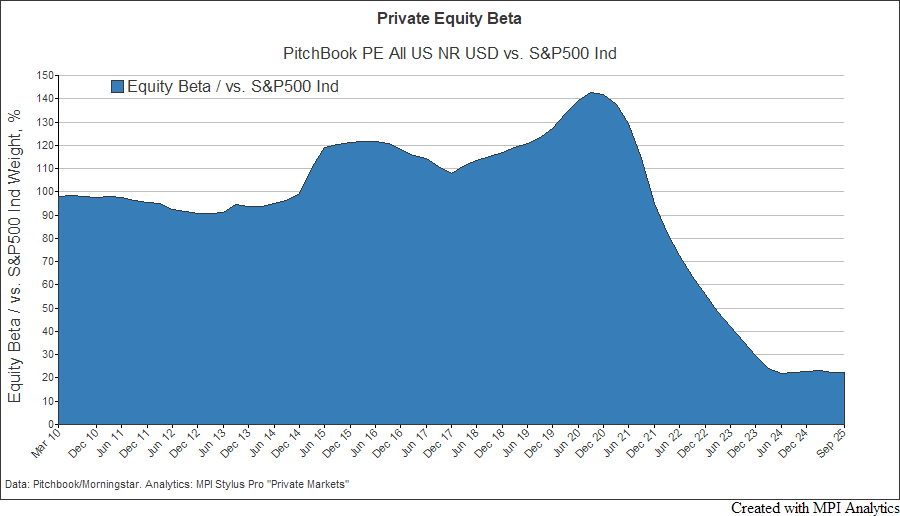
In the chart below we analyze Morningstar/Pitchbook U.S. PE Index vs. S&P500 Index in MPI Stylus Pro to determine the time-varying beta of the former. The index provides a reasonable proxy for the $14.7B PRINCO’s PE allocation consisting of hundreds of individual LP interests. The analysis shows PE market beta hovering around 1.0 and reaching its peak of ~1.4 around FY21 to fall to ~0.2 in just two fiscal years. Such record low beta for an extended period of time is the product of depressed valuations, low deal volume, rising interest rates, valuation lags/staleness, among others.
With little or no effective U.S. equity exposure from public markets, and with private-equity beta falling sharply, Princeton’s dominant equity-like allocation no longer provided the same participation in the U.S. equity rally. The result was a portfolio that appeared to carry substantial illiquid equity risk while showing very little effective U.S. equity exposure.
Had PRINCO been monitoring total effective equity exposure in real time, the changing beta of private equity might have led to a different hedge calibration — including reducing the hedge, removing it, replacing lost equity exposure through more liquid instruments such as futures and/or evaluating potential equity exposure cancellation due to the “Independent Return” sleeve, Princeton’s nomenclature for hedge fund-like investments.
That is why private-market risk has to be monitored at the total-portfolio level — not solely through bottom-up appraisals of hundreds of private companies.
The lesson: allocations are not exposures
Princeton’s experience illustrates why total-portfolio return behavior can reveal what position-level information and reported asset-class allocations may miss. Total return takes everything into account: public and private assets, hedge-fund exposures, overlays, valuation lags, leverage, and the way all of those elements net against one another.
The lesson is not that hedging was wrong, or that private equity was the problem. The lesson is that positions, allocations, and sleeves must ultimately be evaluated through the behavior of the total portfolio. For large asset owners, especially those with substantial private and hedge-fund allocations, the relevant question is not simply: What do we own? It is: How is the portfolio actually behaving — after all exposures and overlays net out?
In Princeton’s case, MPI’s returns-based analysis suggests that the answer changed materially over time. That change helps explain how an endowment described by PRINCO as 94% allocated to equity or equity-like assets could still miss much of the U.S. equity rally.
That is the central lesson from Princeton: allocations are not exposures — and in complex portfolios, the difference can define the outcome.
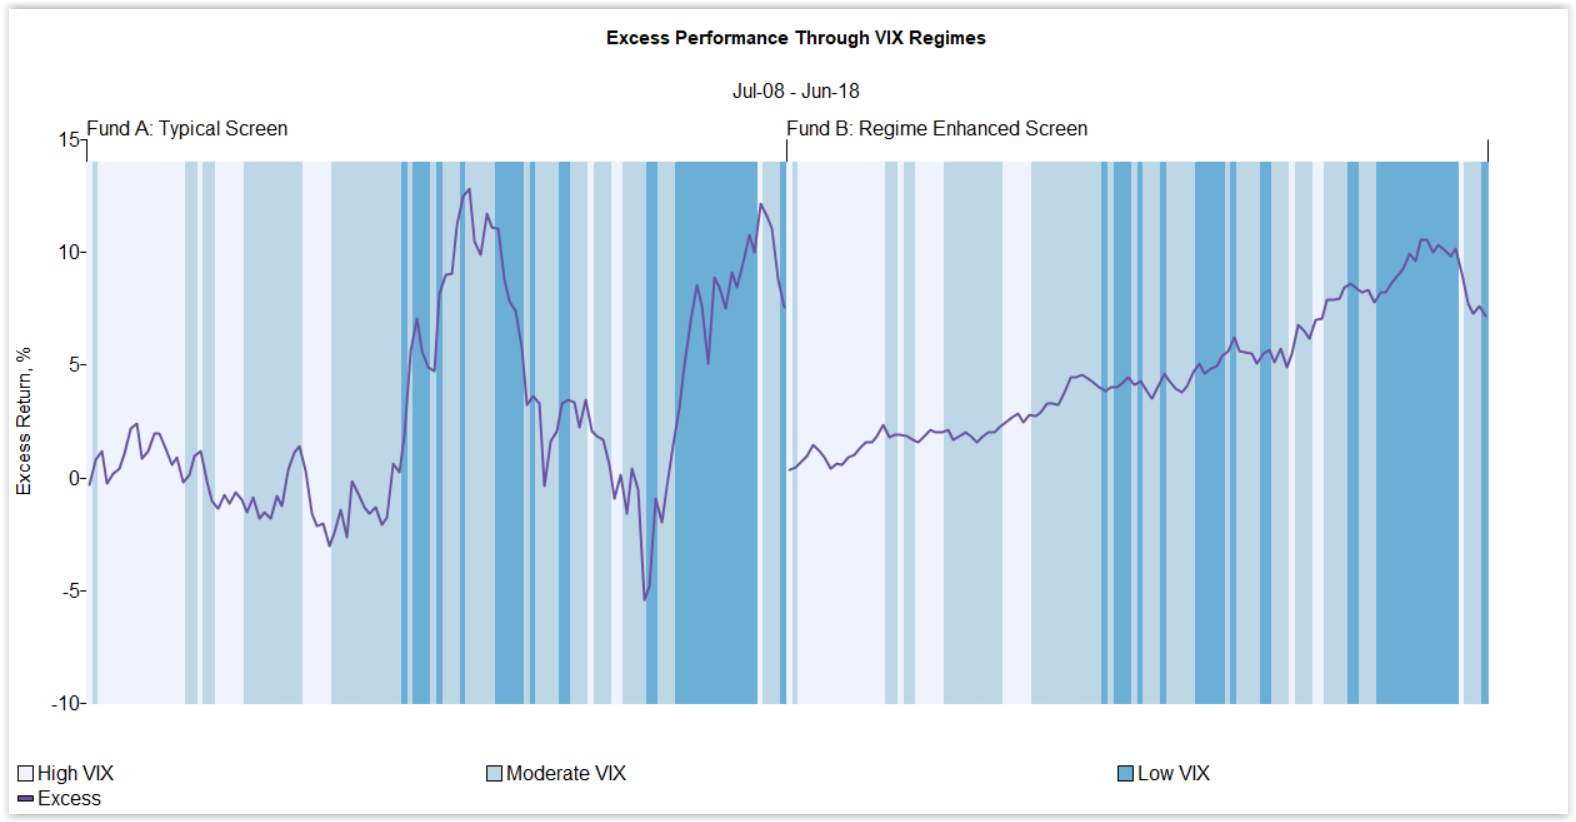
Assess a fund’s potential exposure to complex hypothetical market shocks or historical regimes in MPI Stylus Pro.
[1] Disclaimer:
Some statistics on this page are based on exposure estimates obtained through quantitative analysis of university endowments published annual returns and, beyond any public information, MPI does not claim to know or insinuate what the actual strategy, positions or holdings of the funds are, nor are we commenting on the quality or merits of the strategies. Deviations between our analysis and the actual holdings and/or management decisions made by funds are expected and inherent in any quantitative analysis. MPI makes no warranties or guarantees as to the accuracy of this statistical analysis, nor does it take any responsibility for investment or any other decisions made by any parties based on this analysis.
Technology Solutions
Trusted by


