FY26 Endowments Halftime: SpaceX Gains and the MIT Puzzle
Penn, Stanford and MIT have reported sharply different FY26 returns. MPI examines the emerging endowment puzzle through the lens of economic exposures and portfolio risk.
Elite endowments in the MPI Transparency Lab are reporting FY26 results, and a puzzle is emerging. Penn returned 27.4%, Stanford 31.7%, and MIT 10.3% for the year ended June 30, 2026. Stanford’s figure covers its Merged Pool; MIT’s covers its unitized pool of endowment and other funds.
Our earlier SpaceX analysis suggested a rough framework for the coming results: returns around 20%, with substantial SpaceX exposure potentially lifting some portfolios toward 30%. These were scenarios based on estimated economic exposures through FY25. MIT also showed a SpaceX signal; holding that estimated exposure constant implied a potential 6.2 percentage-point FY26 contribution. Its reported result therefore deserves a closer look.
MIT’s FY26 Treasurer’s Report discloses $376.5 million in derivative losses, versus $203.8 million in FY25, and average net derivative notional exposure of short $2.7 billion. MIT says these instruments are used primarily to hedge market and currency risks; those losses cannot simply be labeled losses from leverage. For scale, $376.5 million is about 1.4% of MIT’s opening $27.4 billion endowment value—well below the roughly 10 percentage-point gap with our earlier 20% scenario.
The stakes extend beyond an annual performance ranking. In September 2025, MIT President Sally Kornbluth warned of “significant new financial pressures,” including higher endowment taxes and uncertainty over federal research funding. In our subsequent research, MIT’s Risky Business, we found MIT comparatively resilient on liquidity but unusually exposed to market risk. As we wrote then: “Where MIT truly stands out is portfolio volatility.” Our factor-based estimate put its 10-year annualized volatility at 21.6%, versus roughly 11% for a global 70/30 benchmark. This season illustrates the other side of concentrated risk: a portfolio can benefit from a winning theme while losing on another.
Using the reported FY26 returns, we updated our FY25 analysis in MPI Stylus PRO for the three schools. Penn and Stanford continue to show separately identified SpaceX exposure. MIT’s incremental SpaceX signal disappears in the updated model, while exposure to digital-assets alternatives remains. A sale of LP interests is one possible explanation for the change, but the returns alone cannot establish that a sale occurred.
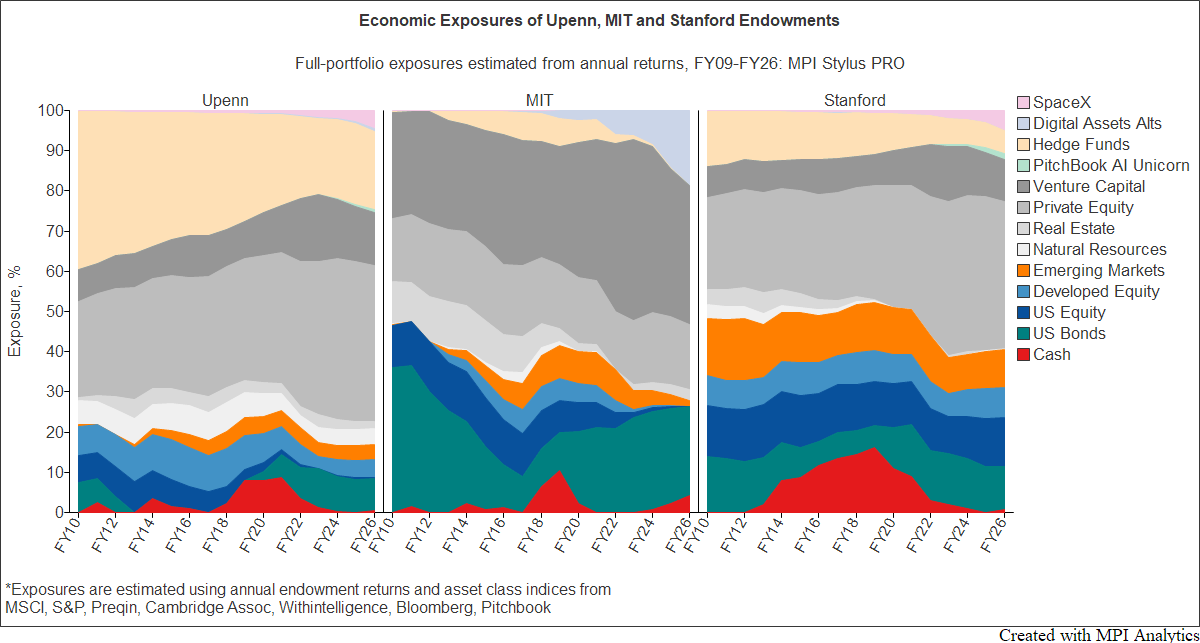
We also observe a rapid decline in MIT’s estimated public equity exposures beginning in FY23. By FY26, only a small emerging markets exposure remains and exposures to both developed markets ex-U.S. and U.S. equities have disappeared. One possible explanation is that MIT implemented an equity hedge similar to Princeton’s, potentially related to the $376.5 million in derivative losses noted earlier. In our earlier piece, Princeton’s declining returns: an equity hedge story, we explained why hedging private equity requires accounting for its changing beta. If PE’s sensitivity to public equities falls while the hedge remains unchanged, the portfolio can become overhedged and miss much of an equity rally.
Another interesting observation from the Economic exposure chart is that around FY2018 traditional hedge fund exposure morphs entirely into digital assets hedge fund exposure. Coincidentally, according to this article in The Information, MIT started investing in Crypto as early as 2018 along with Stanford and Harvard.
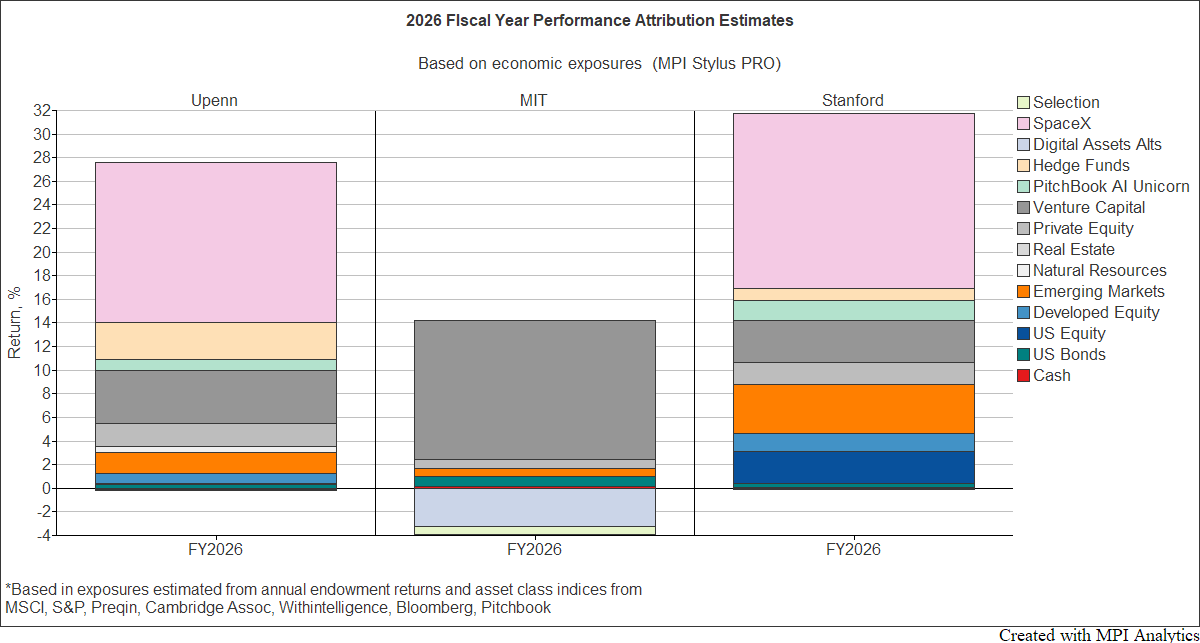
The FY26 attribution estimates show very different drivers:
| Endowment | Reported return |
Incremental SpaceX |
Venture capital |
Digital assets alternatives |
| Penn | 27.4% | +13.53 pp | +4.50 pp | |
| Stanford | 31.7% | +14.89 pp | +3.56 pp | |
| MIT | 10.3% | +11.74 pp | −3.20 pp |
Source: MPI Stylus PRO analysis of annual endowment returns. Contributions are model estimates in percentage points, not disclosed holdings or allocation weights. The SpaceX factor estimates exposure beyond that already embedded in the VC benchmark.
For Penn and Stanford, the model attributes approximately half of the total return to incremental SpaceX exposure. MIT continues to show the largest modeled VC exposure of these three endowments, with a strong positive contribution from venture capital. Its digital-assets alternatives exposure, however, subtracts 3.2 percentage points.
That makes crypto a plausible contributor to MIT’s weaker result. Adding back the estimated drag, while holding every other contribution unchanged, would put its return around 13.5%. It’s also about the opportunity cost: if the digital assets exposure were instead allocated to better performing hedge funds (16.2% in FY26) or U.S, Equities (22.3%), the total return would have been closer to 20% return typical of larger endowments. However, the absence of an earlier identified SpaceX contribution remains another part of the puzzle.
As we noted above, there is public background supporting the possibility of crypto exposure at MIT. In February 2025, Bitwise named MITIMCo among the investors in its $70 million equity financing. That establishes an investment in a crypto asset manager; the announcement does not disclose MITIMCo’s commitment or establish an allocation to Bitwise’s funds.
Some of MIT’s crypto exposure could also come through its venture capital investments. The page accompanying MITIMCo’s Ryan Akkina’s January 2024 interview identifies Sequoia and a16z among the managers he backed. Sequoia’s Great Causes website names MIT among the institutions its investments support. In February 2022, Sequoia described investing in both equity and tokens over the preceding five years and announced a liquid-token fund. Slow Ventures has also publicly identified MIT as an LP in its Creator Fund I, while separately listing Solana among its earliest investments. These disclosures establish manager relationships, without confirming MIT’s participation in specific crypto investments or funds. The model identifies crypto sensitivity but cannot determine which investment sleeve produced it.
Our FY25 research had already identified digital assets as a plausible contributor to MIT’s strong 14.8% return. The updated FY26 analysis is consistent with that exposure becoming a drag. MIT’s Treasurer’s Reports provide broad investment categories and valuations, without the fund-level detail needed to verify this attribution. The model’s digital-assets factor uses the With Intelligence Digital Assets Hedge Fund Asset-Weighted Index; it cannot identify a specific manager.
For context, Grayscale’s diversified Crypto 5 fund returned +47.49% in FY25 and −46.16% in FY26 on a NAV basis, according to HFR data for the years ended June 30. That reversal illustrates how crypto could help in one year and hurt in the next. This fund is a market example, not an identified MIT holding or the hedge-fund benchmark used in our model.
Did MIT reduce or sell its SpaceX exposure? Annual returns cannot establish that. Changes in exposure, valuation timing and overlap among the VC, AI and SpaceX factors could all affect the estimates. A zero incremental SpaceX contribution in the updated model also leaves open exposure already captured by the VC benchmark.
The results highlight how concentrated themes can move total-endowment returns. Our model attributes much of Penn’s and Stanford’s exceptional gains to incremental SpaceX exposure; digital assets offer a plausible explanation for part of MIT’s weaker result.
According to MPI Transparency Lab, through FY25 MIT had the second highest 10-year return among the ten elite schools we follow, including all eight Ivies. It also had the highest estimated portfolio risk – almost twice that of Columbia, which had the lowest estimated risk in the group. Our MPI Stylus PRO risk estimates reflect economic exposures inferred from annual endowment returns. Quarterly returns, if available, would provide a clearer view of changes in those exposures and help narrow the possible explanations for the FY26 result. That perspective can be valuable even to CIOs: holdings reports and asset allocation labels may obscure common economic risks across managers and strategies.
For due diligence, the next questions are specific: did MIT change its SpaceX exposure, which strategies produced the crypto sensitivity, and how much of the difference reflects valuation timing? A headline return cannot answer those questions. The value of the analysis is in showing where to look.
Explore the MPI Transparency Lab and download individual endowment reports featuring MPI Stylus PRO estimates of economic exposures and risk, along with stress tests and scenarios.
Technology Solutions
Trusted by