Harvard’s 27.1% Return: Tracing the SpaceX Effect
We compare Harvard with its peers and examine how concentration, long-term performance and portfolio risk change the picture of this year’s winners.
Harvard reported on October 15 that its endowment returned 27.1% for the fiscal year ended June 30, 2026, bringing its value to $68 billion and placing it alongside Penn and Stanford in the higher-return group we anticipated. Using the newly reported return, our updated analysis in MPI Stylus PRO attributes more than 10 percentage points of Harvard’s FY26 result to incremental SpaceX exposure, consistent with our earlier scenario that a substantial position could lift an otherwise strong year toward 30%.
In Before the Disclosure: Identifying SpaceX Exposure in Elite Endowments, we described two broad scenarios for the elite endowments we follow: returns around 20% for portfolios with little incremental SpaceX exposure, and closer to 30% where a substantial position could add roughly 10 percentage points. In the spirit of Tolstoy, this looked like a season of happy and very happy CIOs, with SpaceX giving some of the happiest something in common.
The first external check came before this reporting season, when Harvard disclosed a $2.21 billion SpaceX shareholding in its June 30 Form 13F on August 14, three days after we posted our exposure analysis on LinkedIn. Penn’s 27.4% and Stanford’s 31.7% subsequently fit the higher-return scenario, while Brown’s 19.6%, announced October 9, provided a check on the roughly 20% group, where our model detected little incremental SpaceX exposure.
What Harvard reported
HMC chief executive N.P. Narvekar wrote: “This past year’s performance was driven primarily by three asset classes: venture capital, public equities, and hedge funds.” The reported allocation helps put that explanation in context: private equity represented 46% of the endowment at June 30, including 31% in venture capital and growth venture, while hedge funds accounted for 29% and public equities for 14%.
Those allocations describe broad portfolio categories, whereas our analysis asks which economic exposures drove Harvard’s total return and how much additional sensitivity to SpaceX is needed beyond the exposure already embedded in the venture-capital benchmark. The $2.21 billion shareholding confirms ownership at June 30, but Harvard may also have exposure through underlying funds, and the filing cannot reconstruct its full investment history or establish SpaceX’s contribution to the fiscal-year return.
Updating the attribution
To examine that contribution, we updated the MPI Transparency Lab with the newly reported FY26 returns and reran the augmented analysis in MPI Stylus PRO, separating the incremental SpaceX contribution from venture capital and the other asset-class factors. Because SpaceX exposure already embedded in the VC benchmark remains part of the VC contribution, the separate factor measures the additional sensitivity needed to explain the portfolio’s return.
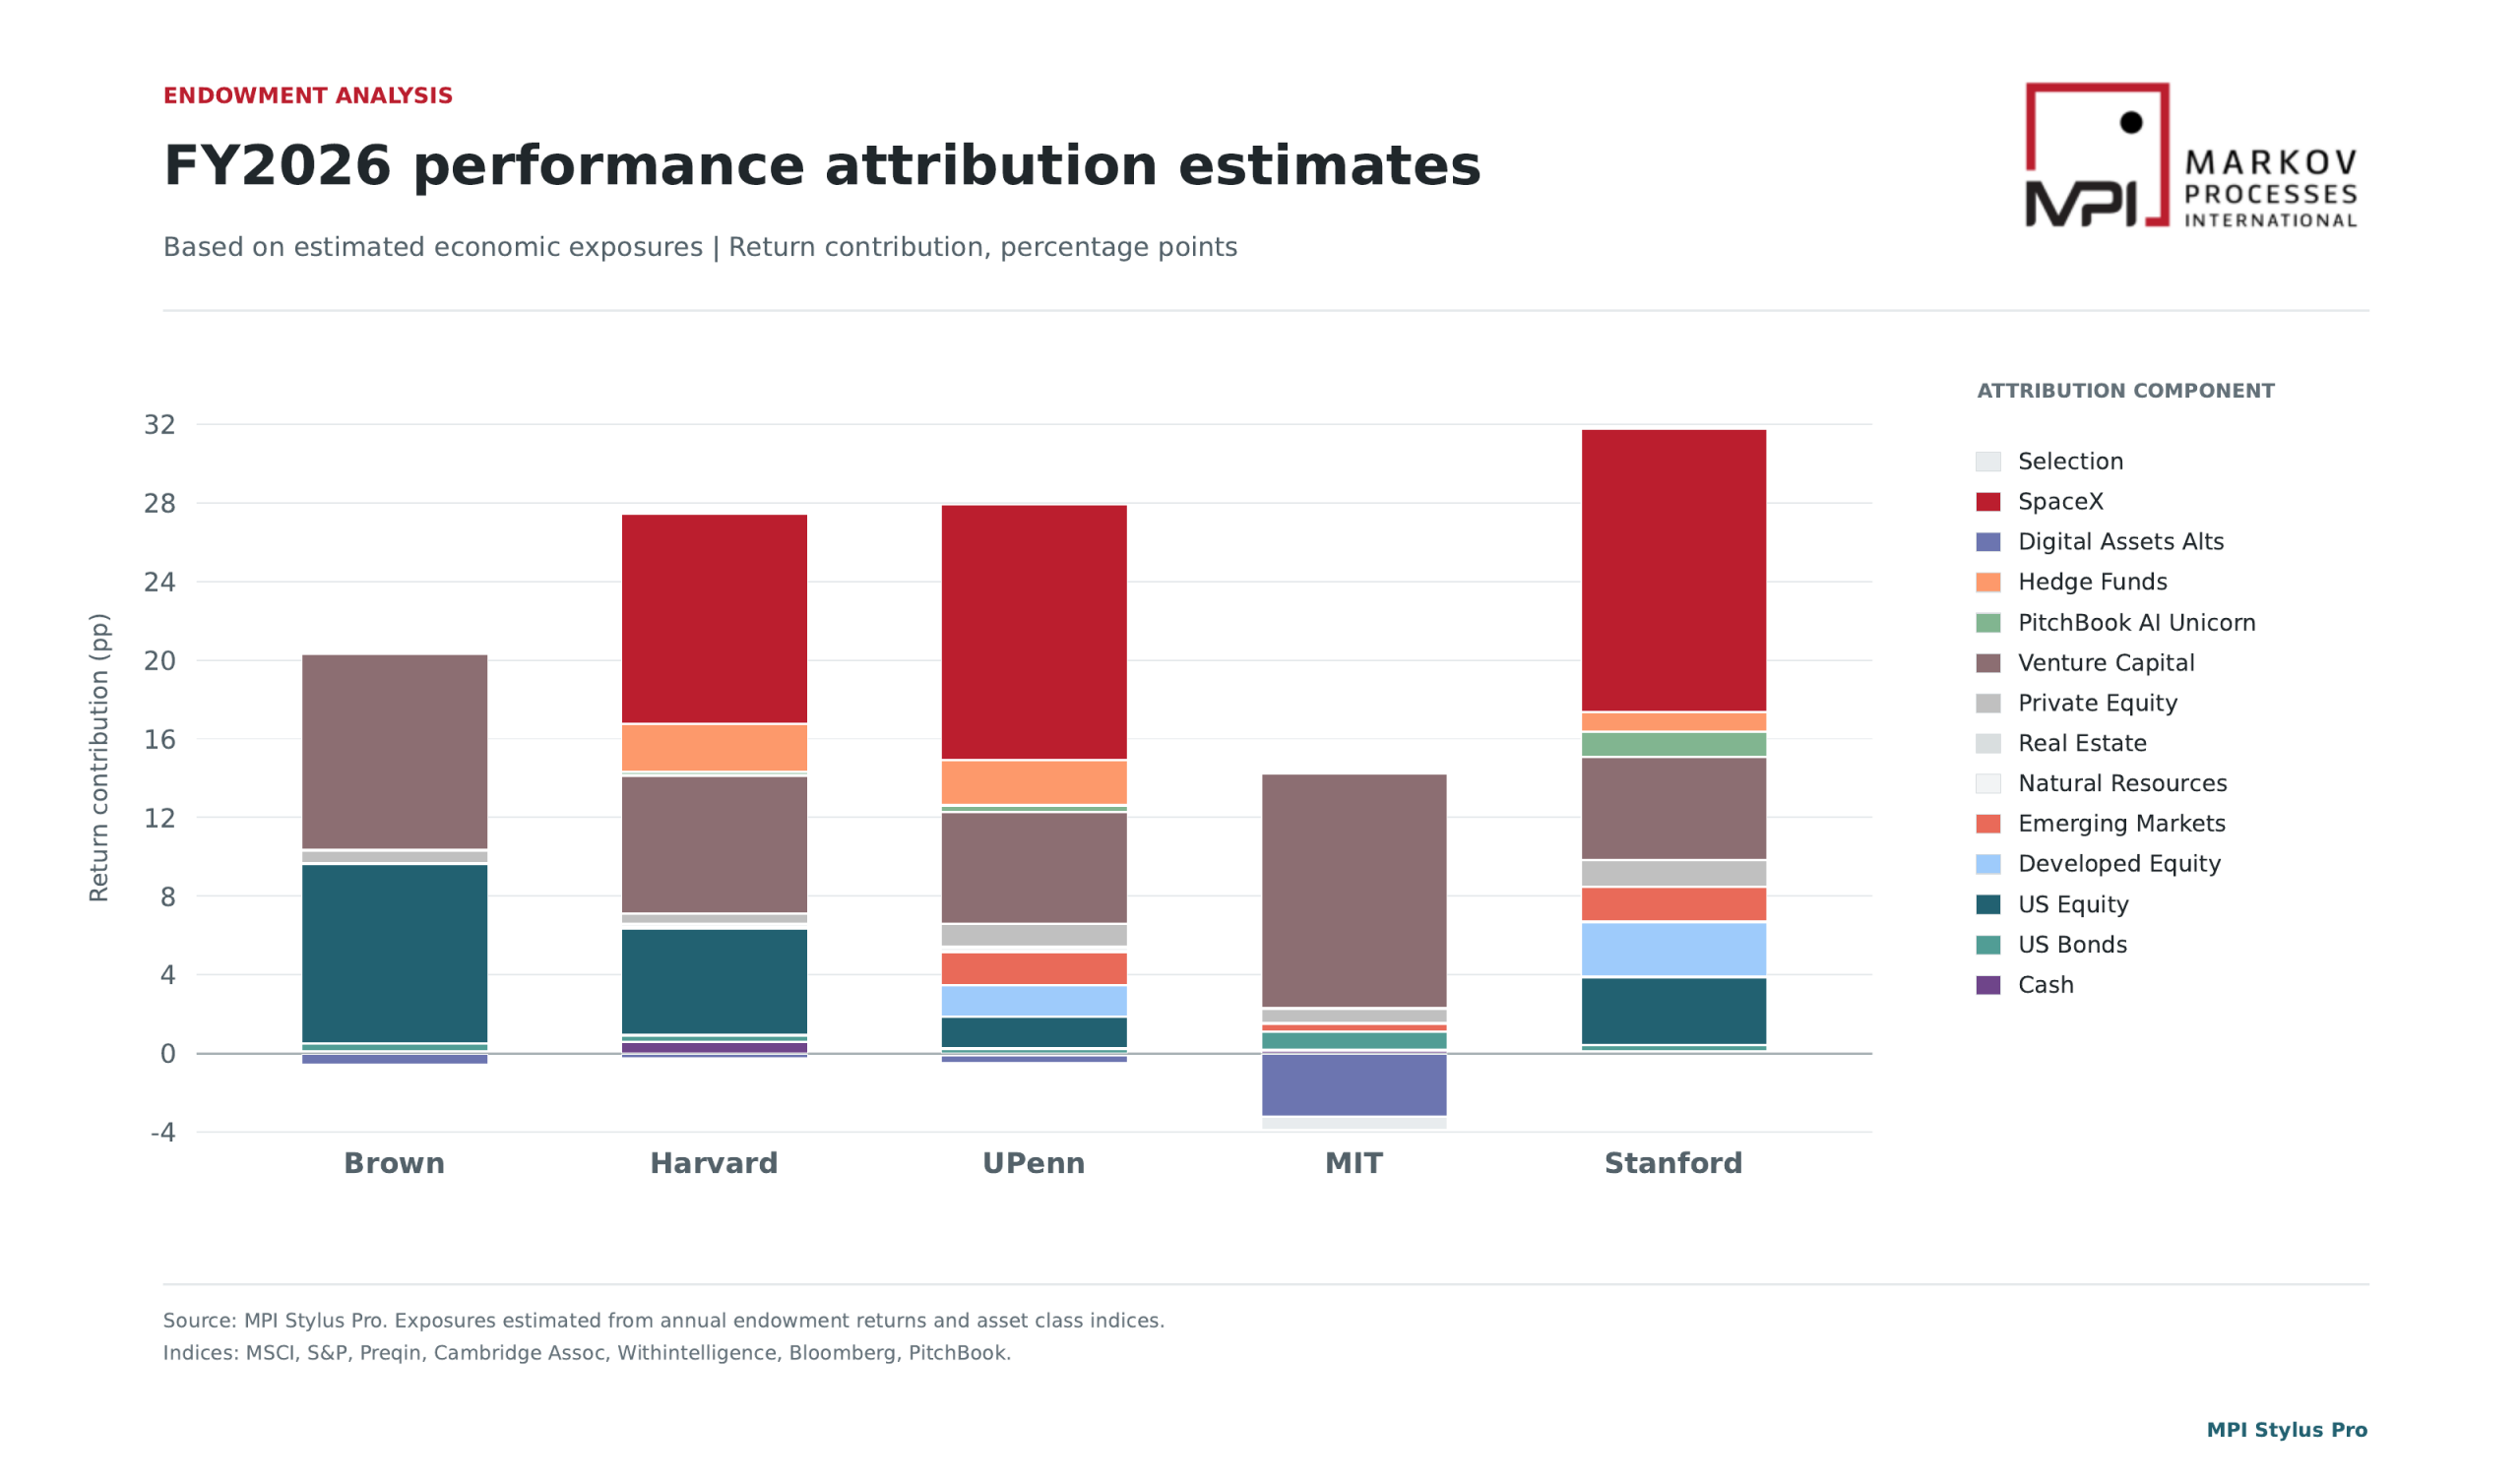
Our earlier scenario used exposures estimated through FY25 to calculate a potential 7.8 percentage-point SpaceX contribution for Harvard, while the model updated through FY26 assigns more than 10 points, or roughly two-fifths of the reported 27.1% return. These figures answer different questions: the first was a conditional scenario and the second incorporates the realized FY26 result, so the increase in estimated contribution does not establish that Harvard added to its position.
Harvard almost tied Penn, with the chart suggesting a similar combination of a large incremental SpaceX contribution alongside venture capital, public equities and hedge funds. Within that combination, Penn’s modeled public-equity contribution was spread more widely across international markets, while Harvard’s was concentrated in U.S. equities. Stanford showed the largest incremental SpaceX contribution of the five institutions, whereas venture capital and public equities contributed almost equally to Brown’s return.
MIT remains the exception, as we discussed in FY26 Endowments Halftime: SpaceX Gains and the MIT Puzzle, where its 10.3% return was accompanied by an estimated digital-assets drag, declining public-equity sensitivity and the disappearance of an incremental SpaceX signal seen in our earlier analysis. Those findings raise questions about whether an equity hedge or a change in SpaceX exposure contributed to the result, although there is no public confirmation of either explanation.
Reading the SpaceX timeline
With FY26 included, the exposure timeline shows the strongest increase in Stanford’s estimated excess SpaceX sensitivity in the later years, followed by Penn and Harvard, while Brown and MIT show little separately identified exposure in the updated fit.
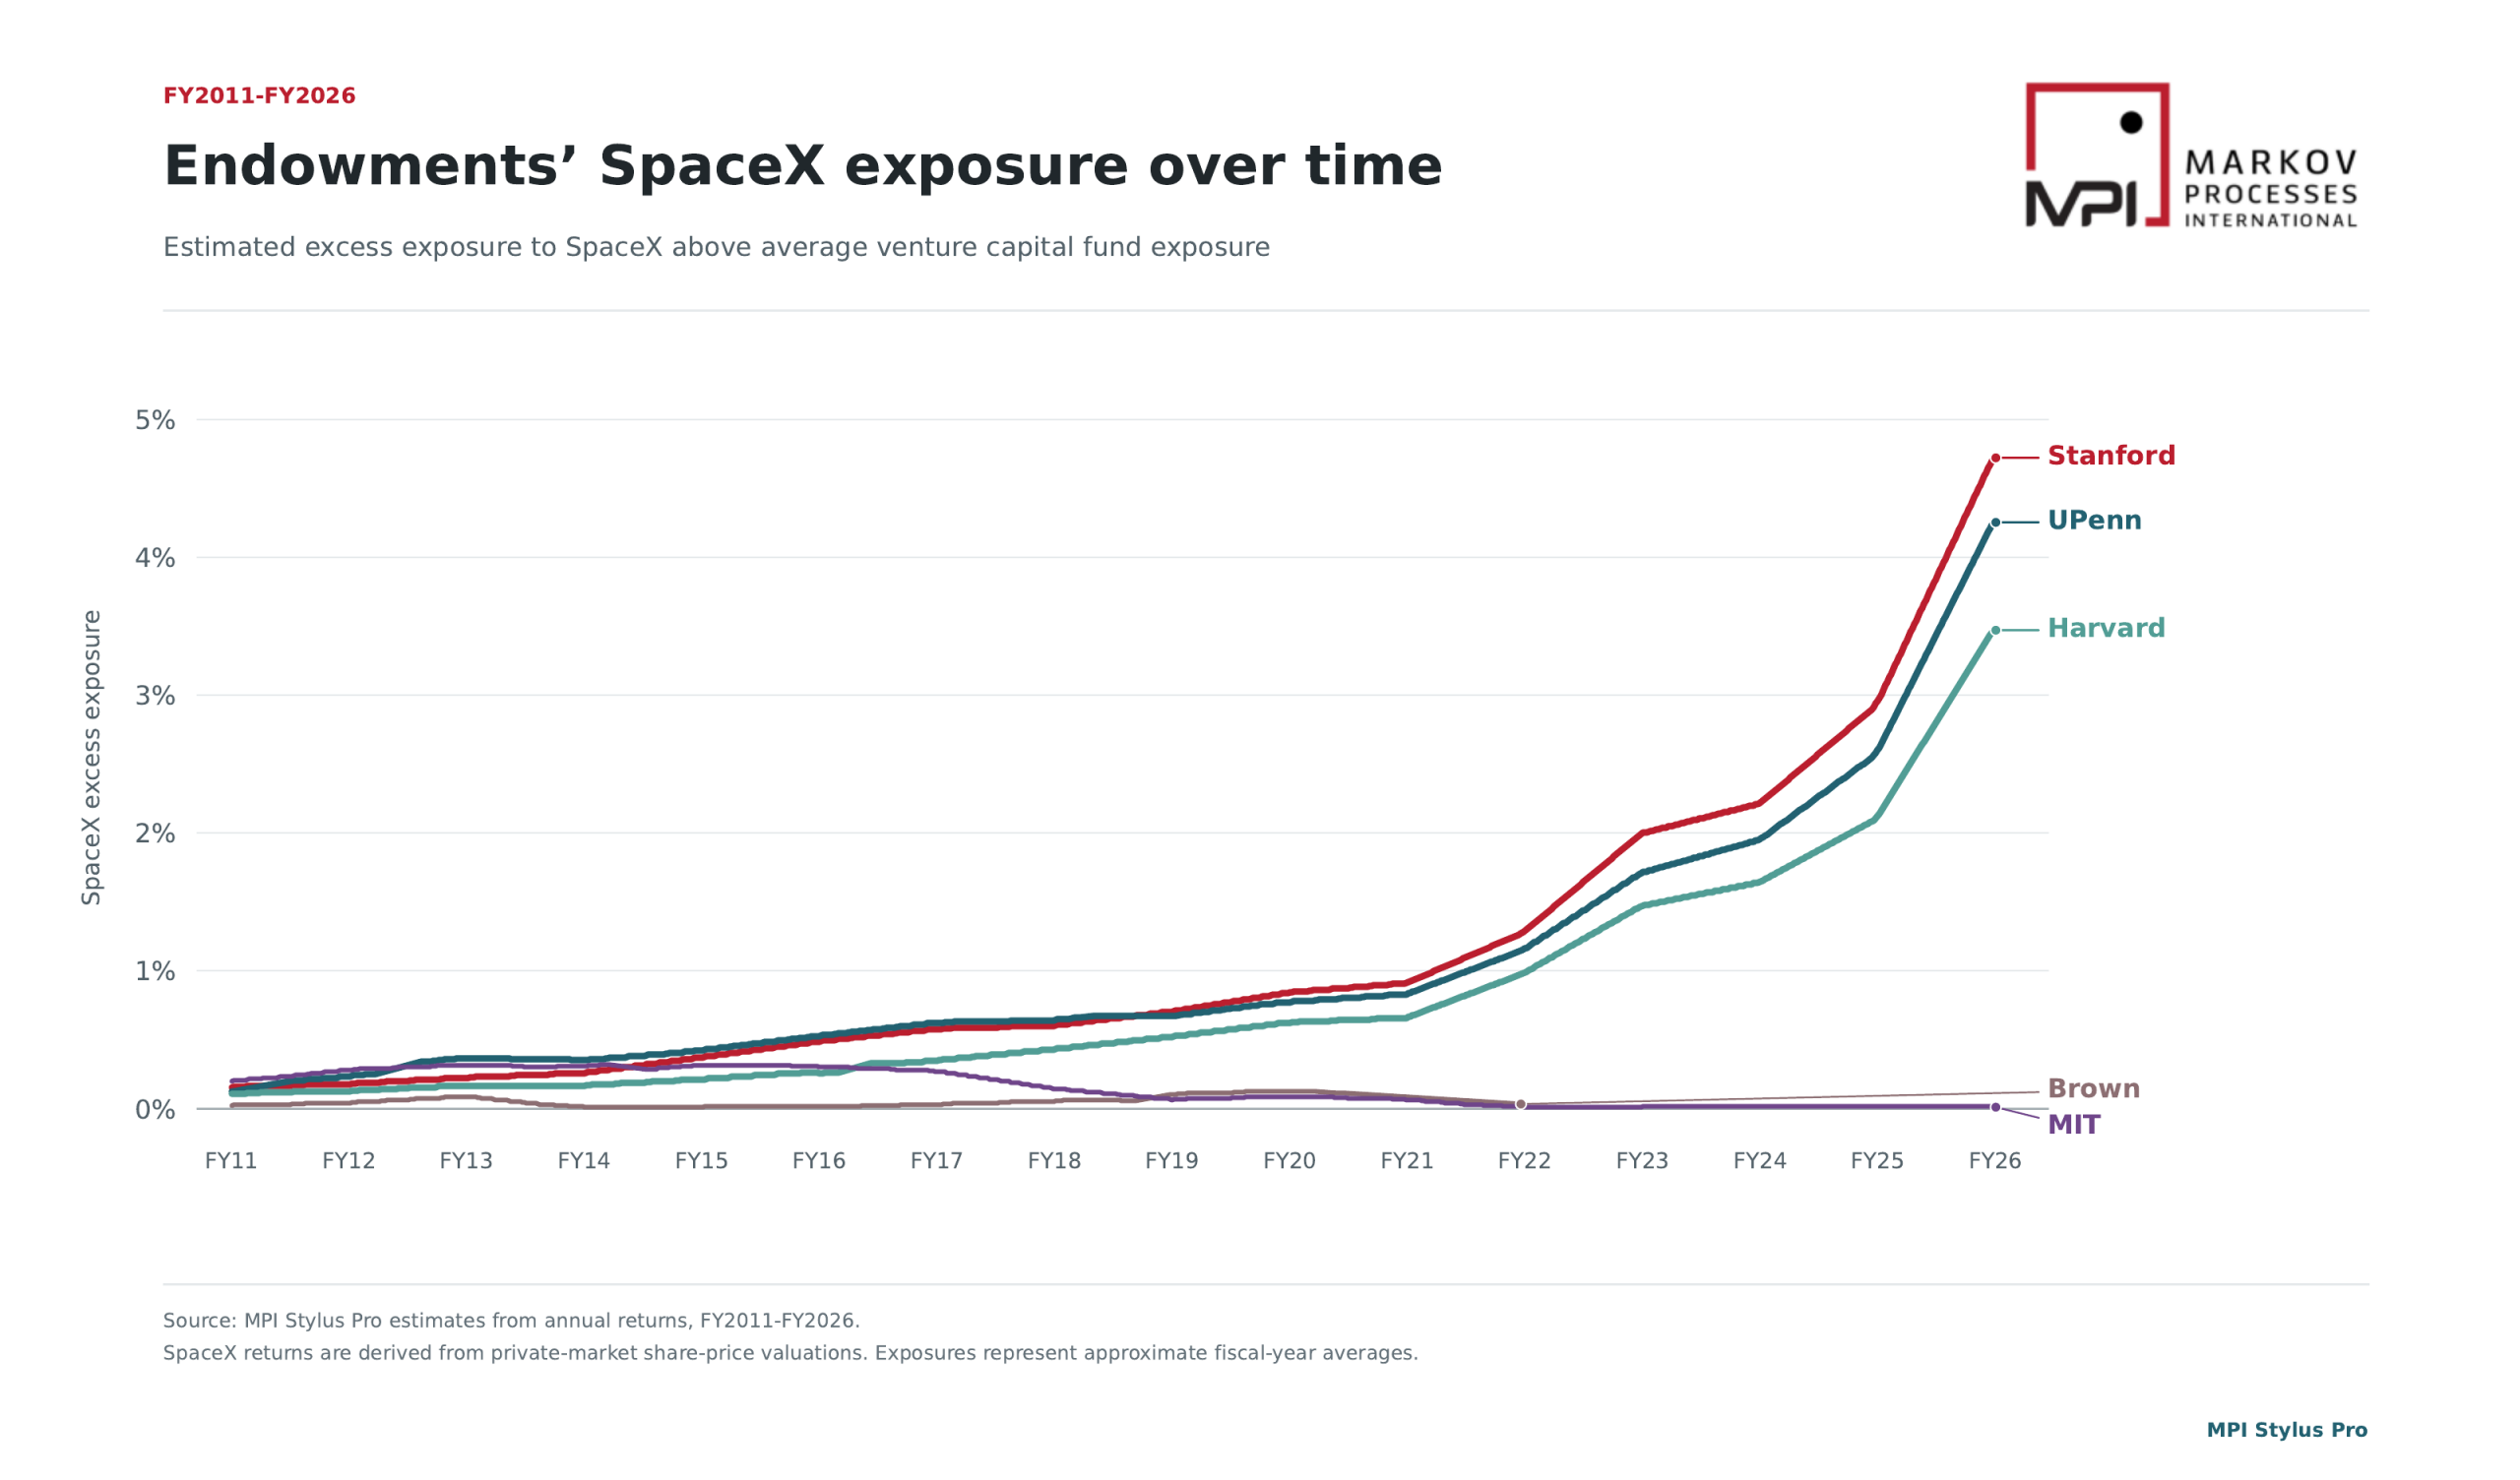
The timeline shows when SpaceX-like returns became economically important to the total portfolio, but a small early holding may leave little detectable signal for years, limiting what it can tell us about who invested first. Adding FY26 data can also revise the estimated historical path, while differences in valuation timing and overlap with other private-market factors affect how much of the return the model can separately attribute to SpaceX.
Harvard therefore provides two useful checks on our original analysis, through a subsequently disclosed shareholding and a strong FY26 result consistent with meaningful SpaceX sensitivity. Although the precise contribution remains a model estimate, the scale is what matters to an investment committee: a single company can become a major driver of a portfolio built across many managers and asset classes.
Since that concentration can emerge through years of appreciation, measuring the economic exposures in the finished portfolio provides an important check on whether its risks still match the institution’s intended design. CIOs with quarterly total-portfolio returns can repeat this analysis in Stylus PRO as a regular QA check, bringing the exposures that distinguished this year’s performance into the discussion of next year’s risks.
Tolstoy and the bigger picture
The endowment model is built around a near-perpetual investment horizon. Federal funding cuts and higher endowment taxes are increasing the pressure on university resources and may change this perspective. Still, large allocations of over 50% to illiquid private investments make it especially important to evaluate performance over longer periods.
Despite its roughly 20% FY26 return, Brown retains the ten-year lead among these five institutions, with an annualized return of 13.6%, followed by Stanford at 12.5%, Penn at 12.0%, MIT at 11.7% and Harvard at 11.1%. That changes the picture of which CIOs have most reason to be happy.
So how has Brown maintained its long-term lead while showing little incremental SpaceX exposure in our model? There is another dimension to the comparison—risk—which is central to the MPI Transparency Lab, and our estimates put Brown second only to MIT in the elite group we follow. SpaceX required substantial risk-taking early on, while a large position today carries concentration risk, so a CIO whose portfolio already carries substantial risk may reasonably decide that an additional concentrated bet is unnecessary.
MIT, which has by far the highest estimated risk in our group, may have decided to hedge some of that risk at a cost to its FY26 return, although there is no public confirmation that a hedge explains the result. Its ten-year record nevertheless remains strong, reflecting years of risk-taking that cannot be judged by a single annual result. So, returning to our Tolstoy analogy, risk is what unites these long-term leaders, and understanding the risks behind their returns is essential to evaluating their performance.
Explore the MPI Transparency Lab and download individual endowment reports featuring MPI Stylus PRO estimates of economic exposures and risk, along with stress tests and scenarios.
Method and sources
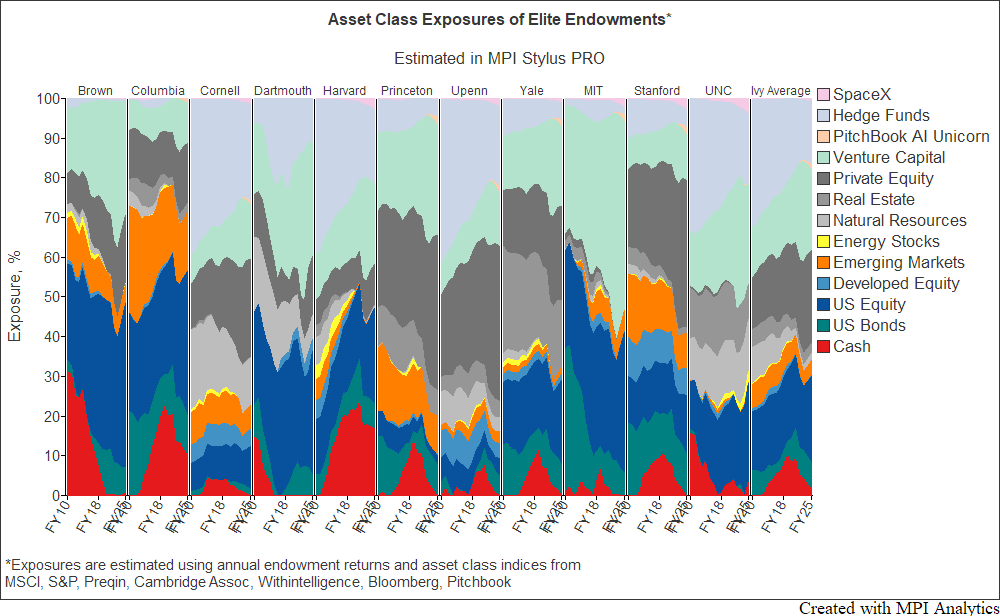
Using annual total-fund returns and asset-class factors, MPI estimates each portfolio’s economic sensitivities, with a separate SpaceX proxy derived from private-market share-price valuations and subsequent public-market prices. These estimates describe economic exposure rather than disclosed capital allocations, and both charts reflect the updated FY26 analysis. Stanford’s reported return covers its Merged Pool, while MIT’s covers its unitized pool of endowment and other funds; all ten-year figures end June 30, 2026. Please visit MPI Transparency Lab for more data and methodology.
Technology Solutions
Trusted by