FY25 Endowments: AI and Crypto to the Moon
We analyze annual endowment returns to offer a plausible explanation for MIT, Stanford, and Michigan’s spectacular FY25 results. The evidence points to AI and digital-asset themes.
Some FY25 endowment results look “too good” to explain with generic manager-speak.
Most elite pools clustered around ~11–12% for the fiscal year ended June 30, 2025. Yet a small group posted mid-teens returns—despite an environment in which endowment-heavy sleeves like hedge funds, private real assets, and much of private markets still trailed public equities.
Key takeaways (FY25)
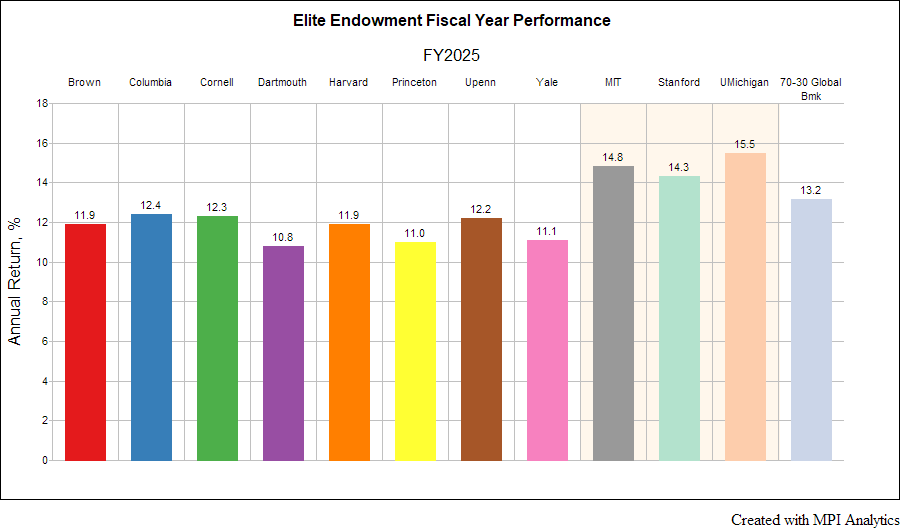
- Most endowments we track in MPI Transparency Lab landed in the ~11–12% range (FY ended June 30, 2025).
- Three were notably higher: Michigan (~$21B) 15.5%[1], MIT (~$27B) 14.8%, Stanford (~$48B) 14.3%.
- That’s ~200–300 bps above the Ivy “cluster” and above a simple global 70/30 (MSCI ACWI / Bloomberg Agg) that we estimate at ~13.2%.
[1] University of Michigan is not covered by the Lab but given its size, high exposure to private equity and FY25 results we were compelled to include it in this analysis.
Question: is this “manager selection,” or is it concentrated exposure to themes—especially AI and digital assets—that are now large enough to move total-fund performance?
To test that hypothesis, we use returns-based attribution in MPI Stylus PRO, adding explicit AI and Digital Assets factors on top of standard asset-class sleeves.
What FY25 market conditions should have implied
Frankly, we expected for the 2025 fiscal year to be mostly a repeat of FY24: anemic bonds, strong public equities, private equity stabilizing, and real estate still weak.
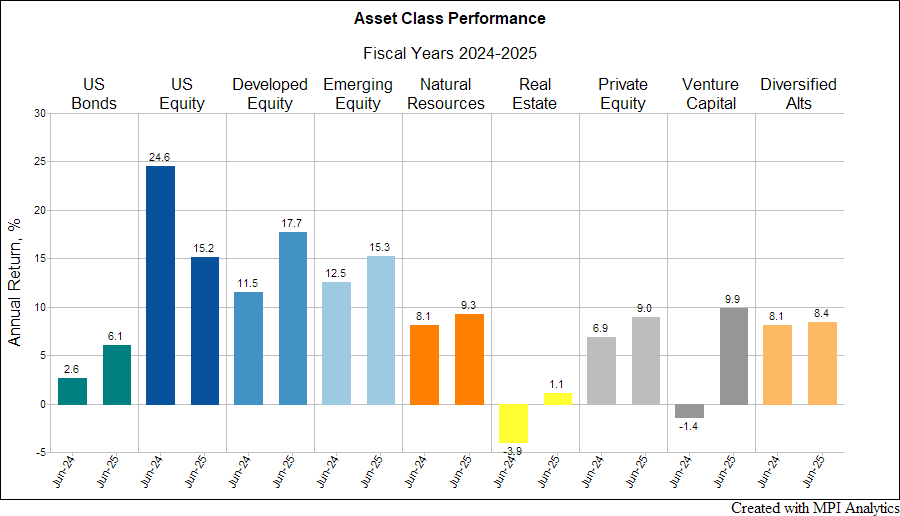
Selected FY25 asset class numbers:
- U.S. Bonds: 6.1% (Bloomberg U.S. Aggregate Index)
- U.S. equity: 15.2% (S&P 500 Index)
- Non-U.S. developed equity: 17.7% (MSCI EAFE Index)
- Emerging markets equity: 15.3% (MSCI EM Equity Index)
- Private Equity (buyout/PE): 9.0% (vs. 6.9% in FY24; Cambridge Assoc)
- Venture Capital: +9.9% (vs. –1.4% in FY24; Cambridge Assoc)
- Diversified / multi-strat hedge funds: 8.4% (8.1% in FY24; Eurekahedge 50 Index)
- Real Estate: 1.1% (-4% in FY24; Cambridge Assoc)
Now assume a typical elite endowment allocation, such as:
- 30–40%+ in private equity / venture,
- Large hedge fund exposure,
- Large private real assets,
- Relatively low traditional fixed income,
- Much less than 50% in broad listed equities.
If you push that mix through FY25’s sleeve returns above, one would expect something closer to 11–12% or lower – definitely not 15%:
- Venture did bounce (~10%), but still trails broad public equity (~15–18%).
- Hedge funds lagged public equities.
- Real estate was basically flat.
- Bonds were in low single digits.
In other words, these portfolios should trail a simple 70/30 in FY25, not beat it by 200 bps. Yet Michigan, MIT, and Stanford surged ahead. That gap is what needs to be examined.
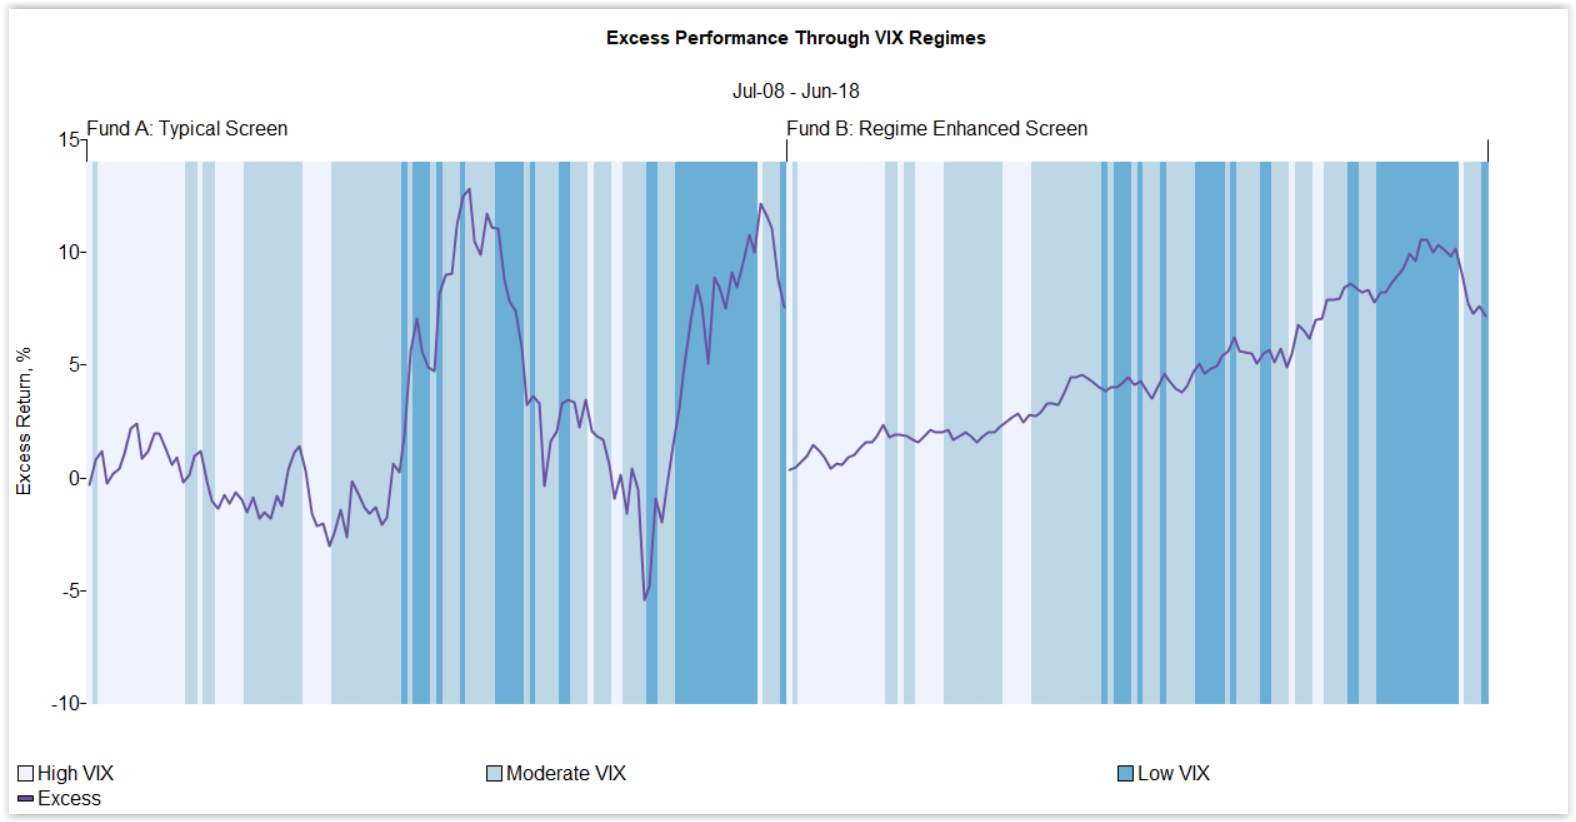
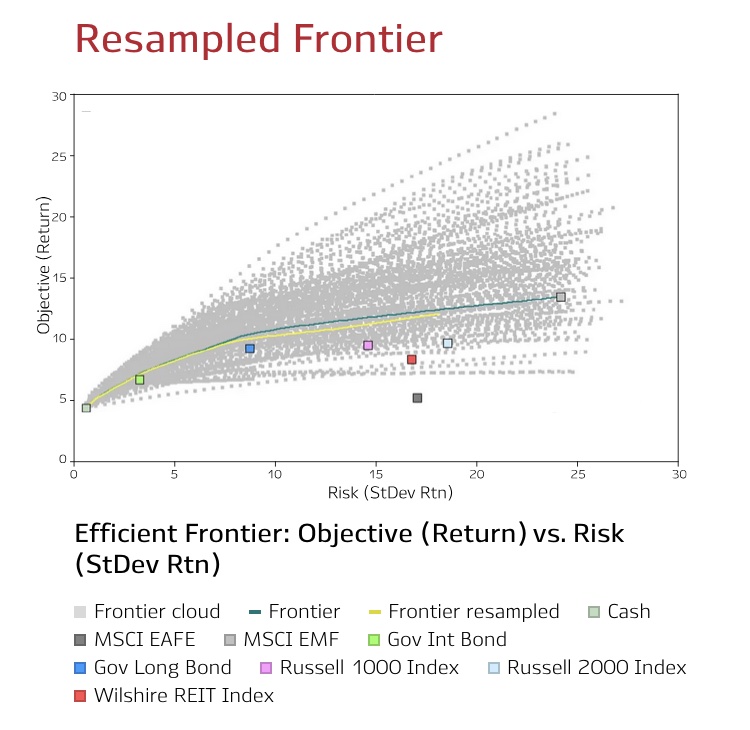
Assess a fund’s potential exposure to complex hypothetical market shocks or historical regimes in MPI Stylus Pro.
CIOs are mum on attribution
If you read FY25 CIO letters and public summaries, you’re unlikely to find attribution. You get familiar language: “resilience,” “discipline,” “manager selection,” “diversification,” “long-term orientation,” and lately, “liquidity management.”
Harvard’s Narvekar, for example, hit the usual notes in FY25: “discerning manager selection,” “returns well above… benchmarks” from Harvard’s public equity and hedge fund managers, and “double-digit gains across diverse strategies and stages” of private equity. That’s it. No specific thematic bets. No sizing. No “2 percentage points from X.” Yet with ~41% allocated to private equity, ~31% to hedge funds, only ~14% to public equities, plus cash, bonds, and real estate, a simple roll-forward of FY25 asset-sleeve returns would point to a single-digit outcome; Harvard’s FY25 12% is exceptional. In a ~$57B endowment with hundreds of external managers and LP interests, idiosyncratic “manager selection” tends to diversify away—the only things that move the needle at the total-fund level are broad themes large enough to show up in the headline number.
We see this pattern outside endowments as well. Retail and institutional products get marketed as “alpha stories.” When our clients run them through MPI Stylus PRO, the result is often simpler: concentrated exposure to one or two themes (AI, crypto, clean energy, etc.) that potentially could be replicated with ETFs. Managers often don’t present it that way, but the return stream does.
This is why top-down, returns-based analysis matters. MPI Stylus PRO effectively searches the portfolio through its own return behavior and identifies the most predictive themes — after diversification has done its job and filtered out noise from hundreds of individual investments.
What’s actually known (publicly) about endowments’ crypto exposure
Direct crypto exposure at U.S. endowments is almost never described in detail. Schools will mention accepting crypto donations, but they will not usually quantify crypto-linked strategies inside the portfolio.
Michigan is a rare exception:
- In 2018, Michigan approved a $3 million commitment to Andreessen Horowitz’s early crypto fund.
- In 2019, Michigan increased that commitment (per Bloomberg at the time).
Separately, The Information reported in 2018 that Harvard, Stanford, MIT, and Dartmouth had made commitments to cryptocurrency-focused funds. Sizing and vehicle names were not made public. Chain Catcher recently specifically identified Yale, Harvard, Stanford, Michigan, and Brown as early LPs in dedicated crypto venture funds like a16z’s crypto fund and Paradigm, and in some cases even buying Bitcoin exposure directly.
Cornell is deeply tied to Avalanche (the AVAX blockchain) via Ava Labs, which was founded by then–Cornell computer science professor Emin Gün Sirer to commercialize consensus tech originally developed at Cornell with his PhD students. Because that core Avalanche technology was created at Cornell, Cornell University itself “owns a percentage of Ava Labs” – essentially a crypto company.
The point is that crypto exposure in these portfolios is not something that suddenly appeared in FY25. It’s been in the plumbing since at least 2018.
What’s actually known (publicly) about endowments’ AI exposure
AI is slightly more visible.
- Michigan is listed as an LP in Alt Capital II, a ~$275M vehicle raised in September 2025 to fund AI-driven enterprise software (“replace legacy tools” positioning).
- There were also reports in late 2023–2024 that Michigan invested directly in OpenAI and/or an OpenAI-associated investment structure.
That last point matters. Normally, endowments get innovation exposure indirectly via VC partnerships. A direct exposure to a specific AI platform company is different. It’s a targeted bet.
We’ve seen similar behavior with crypto infrastructure. Duke’s endowment, for example, showed exposure to Coinbase pre-IPO which we were able to discern from Duke annual returns with high precision. Sometimes the endowment steps around the VC wrapper and goes straight to the theme.
MPI’s powerful factor discovery engine “Factor Search” deciphers some of the most sophisticated strategies.
There is another complication on the AI side that does not show up in the glossy FY25 return number: with late-stage VC, especially AI-focused VC, it’s hard to tell how much of that “15%” is cash-backed and how much is mark-to-model. We’ve already seen large venture franchises markup AI-heavy funds aggressively without distributing anything. For example, Sequoia marked up its 2020 flagship venture fund by roughly 25% in FY24 despite no meaningful exits. That kind of internal markdown/markup flows straight into reported endowment performance, even though it’s effectively “paper.” So when we talk about AI exposure showing up in FY25, part of what we are likely seeing is unrealized, manager-set valuation. That matters for liquidity.
Even without current disclosure, it’s reasonable to assume MIT, Stanford, Harvard, etc. continue to guard their access to top-tier Sand Hill franchises (Sequoia, a16z, etc.), which now function as AI deployment vehicles as much as generalist venture firms.
Making AI and Crypto explicit in the Stylus PRO model
To test whether AI and crypto can plausibly explain that 200–300 bps gap, we extended our returns-based work. We start with standard asset class factors (bonds, public equity, non-U.S. equity, PE, VC, hedge funds, real estate, fixed income). Then we add two explicit thematic factors:
- Digital Assets Alts
– With Intelligence Digital Assets Hedge Fund Asset-Weighted Index
– Captures actively managed digital asset / crypto hedge fund strategies - PitchBook AI Unicorn
– Morningstar PitchBook AI Unicorn Index
– Proxy for large private AI companies (>$1B valuation)
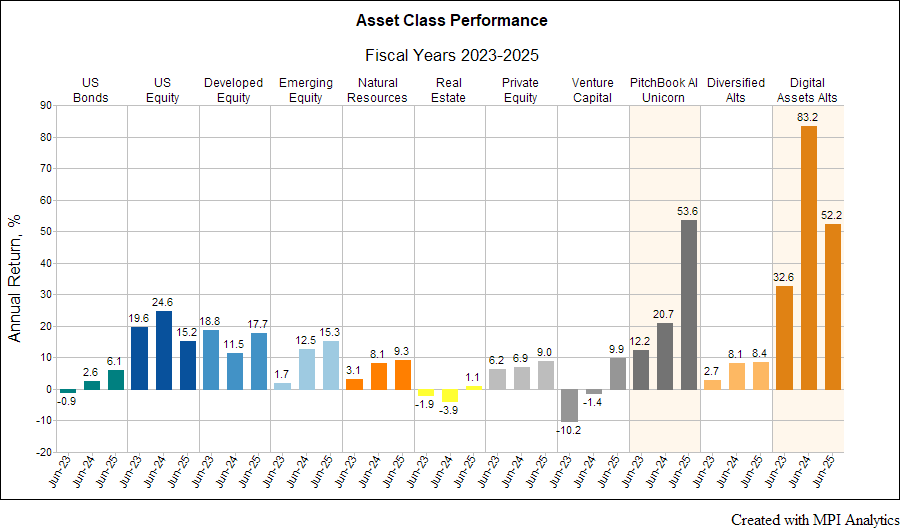
Over the past two years (FY24-25), both AI and Digital Assets have posted extremely high gains (on the order of 50%+ for FY25). That magnitude is enough to move total fund performance by several percentage points if you’re meaningfully exposed.
MPI Stylus PRO exposure mapping
Next step: do those themes actually show up in elite endowments? We ran the returns of major endowments (plus Michigan) through MPI Stylus PRO with AI and Digital Assets turned on as explicit factors.
MPI Stylus PRO takes the annual endowment returns on input and derives an asset index portfolio that tracks the endowment in the most predictive way. Our institutional clients typically use monthly returns for hedge funds and quarterly IRRs to analyze private funds. With elite endowments, unfortunately, we are limited to annual numbers only – but this is where our dynamic model shines.
For endowments, opacity is structural. Most schools only disclose one number per year: “Total Fund return = X%.” You’re expected to take the narrative on faith. Cornell is the lone exception – Cornell publishes quarterly performance, and once you have quarterly data, you’re no longer guessing. You can see stress build, and you can see where performance is actually coming from.
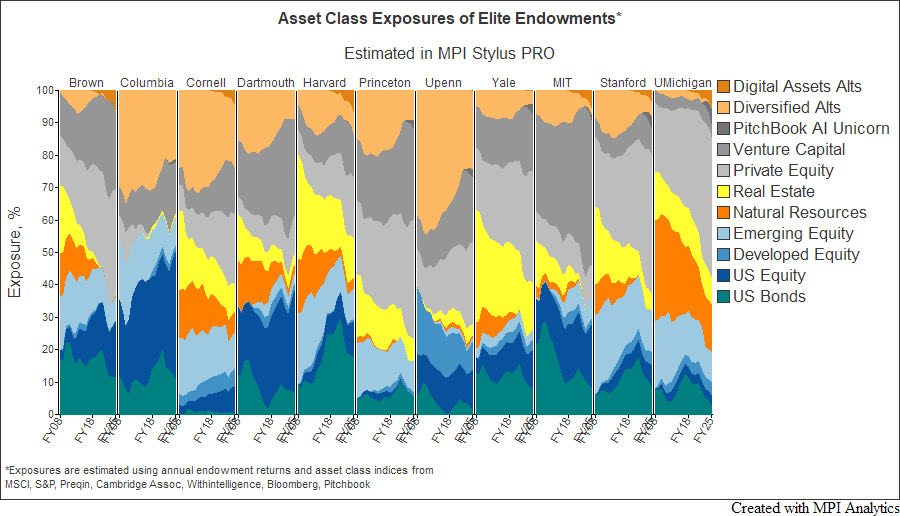
Some observations from MPI’s returns-based mapping of exposures:
- Digital Assets exposure appears at Brown, Cornell, Harvard, MIT, Stanford, and Michigan in a meaningful way.
- Brown, Harvard, MIT, and Stanford were already cited as having crypto investments and our analysis shows that they might have steadily increased by FY25. Even though there are no public sources citing Cornell’s investments into crypto and blockchain funds, Cornell as an institution already has embedded crypto exposure through its ownership stake in Ava Labs.
- AI exposure appears at Princeton, UPenn, Yale, MIT, Stanford, and Michigan.
- Michigan lights up in both AI and Digital Assets.
Two important clarifications:
Economic behavior vs. literal holdings
When Stylus PRO shows “U.S. Equity” or “Fixed Income,” that does not necessarily mean “the fund is literally X% in SPY or Treasuries.” It means part of the return stream behaves that way. Venture exposure can vary in size simply based on its beta to the VC index. Hedge funds with growth bets can map to “equity-like.”
Incremental, not baseline
The AI and Digital Assets factors sit on top of normal VC / hedge fund exposure. If a school does not show exposure to “AI,” that does not prove zero AI holdings. It means that whatever AI they do hold can be explained by a standard VC/hedge mix. We are highlighting cases where exposure appears larger than what a generic VC/hedge allocation would imply.
Saves time and money with MPI’s comprehensive software platform that provides both historical and forward-looking analysis capabilities
Attribution math: Michigan as an example
Exposure is one thing. Attribution closes the loop.
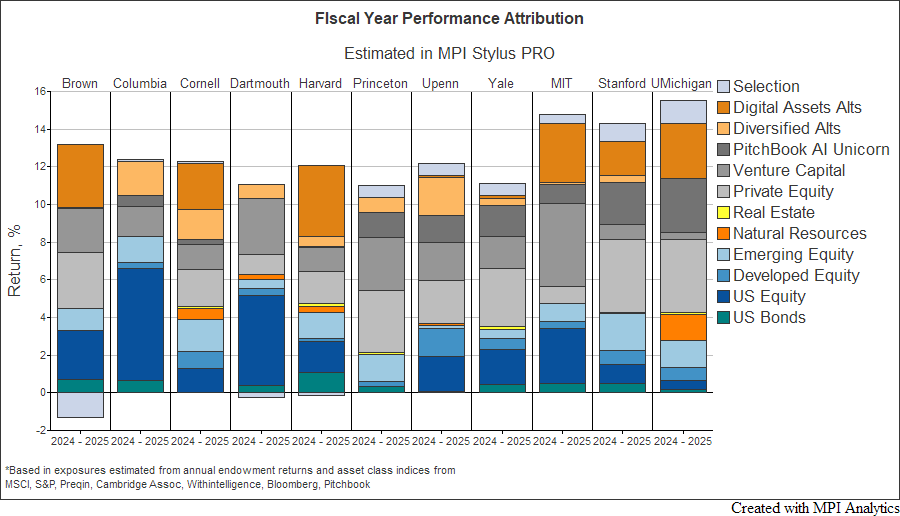
Stylus PRO lets us take Michigan’s FY25 total return (15.5%) and attribute it to asset class sleeves, including AI and Digital Assets.
Approximate FY25 contribution to Michigan’s total return:
- Digital Assets: ~2.9%
- AI-focused strategies: ~2.8%
- “Selection” / residual (manager-specific, idiosyncratic alpha we cannot fully map to broad factors): ~1.0%
Selection aside, the two theme components alone get you roughly 5-6 percentage points of lift. That is essentially the distance between a “should be ~11–12%” endowment outcome (based on basic asset sleeves) and Michigan’s 15.5%.
Harvard shows a similar pattern in our attribution: a meaningful crypto/digital-assets contribution helping deliver a 12% FY25 result despite sizeable allocations to lower-return sleeves in this environment. At the same time, MPI Transparency Lab estimates Harvard’s total volatility among the lowest in the group. In plain English: crypto tailwind inside a comparatively conservative overall risk profile. That is not visible in Harvard’s public FY25 language.
Governance / liquidity / optics
Three points for CIOs, boards, policymakers:
- Outperformance is attributable.
When a diversified $20-30B endowment is 200–300 bps ahead of peers and ahead of 70/30 in FY25, it is unlikely to be generic “manager selection.” It looks consistent with targeted exposure to AI and/or digital assets or other themes that produced outsized gains in FY25, plus some residual manager-specific alpha. - AI and crypto are no longer safely buried under the word “venture.”
For certain pools, AI and crypto are now large enough to move the total reported FY25 result, not just a sub-sleeve. That affects liquidity stress and pacing, governance sign-off, and political optics (“Are we balancing the university budget with crypto gains?”). - Paper vs. cash.
A meaningful portion of “AI performance” in FY25 likely sits inside late-stage venture marks — in some cases manager-led up-rounds, not exits. We’ve already seen a flagship VC fund reportedly marked up ~25% without distributing capital. That accounting uplift flows into the endowment’s annual number, but it is not spendable cash and may never fully realize at that level. Boards looking at a 14–15% fiscal-year return need to ask: how much of that is liquid, and how much is proforma valuation? - Transparency is a choice.
Cornell publishes quarterly performance. Once you have at least quarterly data, attribution is not forensic. You can actually monitor which sleeves are driving results, where risk appears to be concentrating, and what happens under stress. It would be transformational if quarterly reporting became the norm.
Closing thoughts
Michigan, MIT, and Stanford reported FY25 returns in the mid-teens despite large allocations to private equity, venture, hedge funds, and real assets — allocations that, if you simply map them through FY25 asset returns, should have landed them closer to ~11–12% at most.
The difference does not look like unexplained “mystery alpha.” The most plausible story — based on returns behavior, not position-level disclosure — is targeted exposure to AI and crypto.
Endowments don’t spell this out. MPI Stylus PRO, even with annual data only, provides us with a plausible explanation — with the caveat that annual data can overfit, and more granular (quarterly/monthly) disclosure would make this analysis deterministic instead of inferential.
Technology Solutions
Trusted by


