WashU’s 37.3% Return: The Risk Beyond SpaceX
What risks lie behind WashU’s exceptional returns? MPI’s analysis offers valuable lessons for CIOs and endowment boards.
Washington University in St. Louis’s 37.3% FY26 return puts it among the endowments that benefited from an early investment in SpaceX. Yet our analysis suggests that WashU’s results reflect a broader concentration in venture capital and equity risk, with a much smaller separately identified SpaceX effect than we see at several peers. That distinction matters when assessing both the sources of its success and the risks behind it.
WashU’s roughly $50 million investment in SpaceX grew into a position worth billions. Recent reporting places the stake at roughly 10% of the endowment, with its weight varying as the share price changes. SpaceX has clearly been an important investment, but it is only part of the portfolio’s story.
Since Scott Wilson joined as CIO in late 2017, WashU has pursued a concentrated investment approach that includes private funds and co-investments. The long-term results are impressive. Based on the annual returns in our study, WashU earned an annualized 13.66% over the ten years through FY26, narrowly ahead of Brown’s 13.59% and above the ten elite endowments we follow in the MPI Transparency Lab.
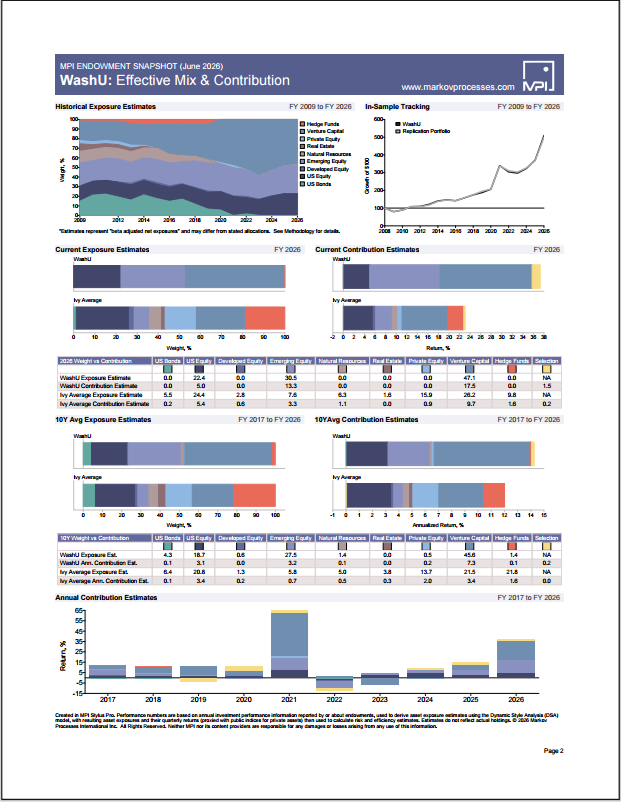
We analyzed WashU’s annual returns in MPI Stylus PRO using the same factor framework applied to other endowments. The chart below compares its estimated economic exposures with those of Harvard, Penn, Stanford and UNC, all of which benefited from SpaceX.
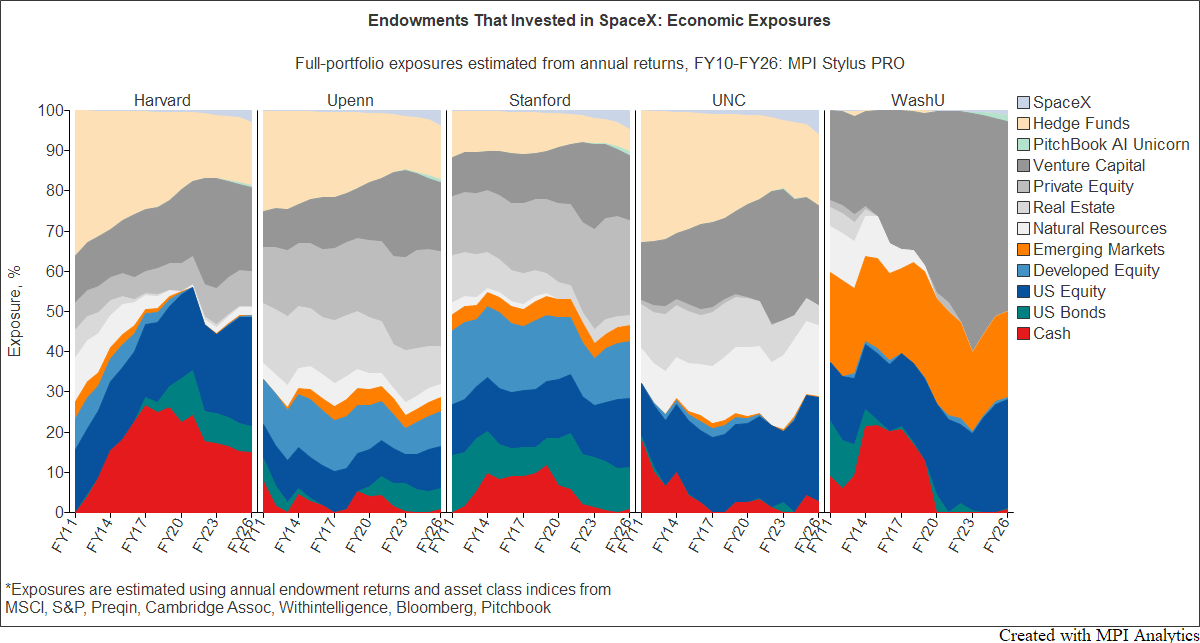
WashU stands out for the dominance of venture capital, which accounts for more than half of its estimated economic exposure. Most of the remainder is divided between US and emerging-market equities. The other endowments show a broader mix of exposures, including hedge funds, private equity, bonds and real assets. WashU’s return behavior more closely resembles a portfolio concentrated in venture capital and equities.
These are economic exposures, not reported allocations. A VC estimate above 50% does not mean that more than half the endowment is invested in funds labeled venture capital. Growth equity, private co-investments and late-stage holdings can share the same underlying sensitivities, and some public equity investments may contribute similar risks. The model estimates their combined effect on portfolio returns.
The exposure history shows a pronounced shift toward VC around 2017 and in the years that followed. The timing broadly coincides with the change in investment leadership, although annual returns cannot establish precisely when individual portfolio decisions took effect.
The FY26 attribution chart below adds an important detail. The model assigns approximately 16 percentage points of WashU’s return to VC, roughly 10 points to emerging-market equities and about 6 points to US equities. The separately identified SpaceX contribution is approximately 4 points, well below the estimates for UNC, Harvard, Stanford and Penn.
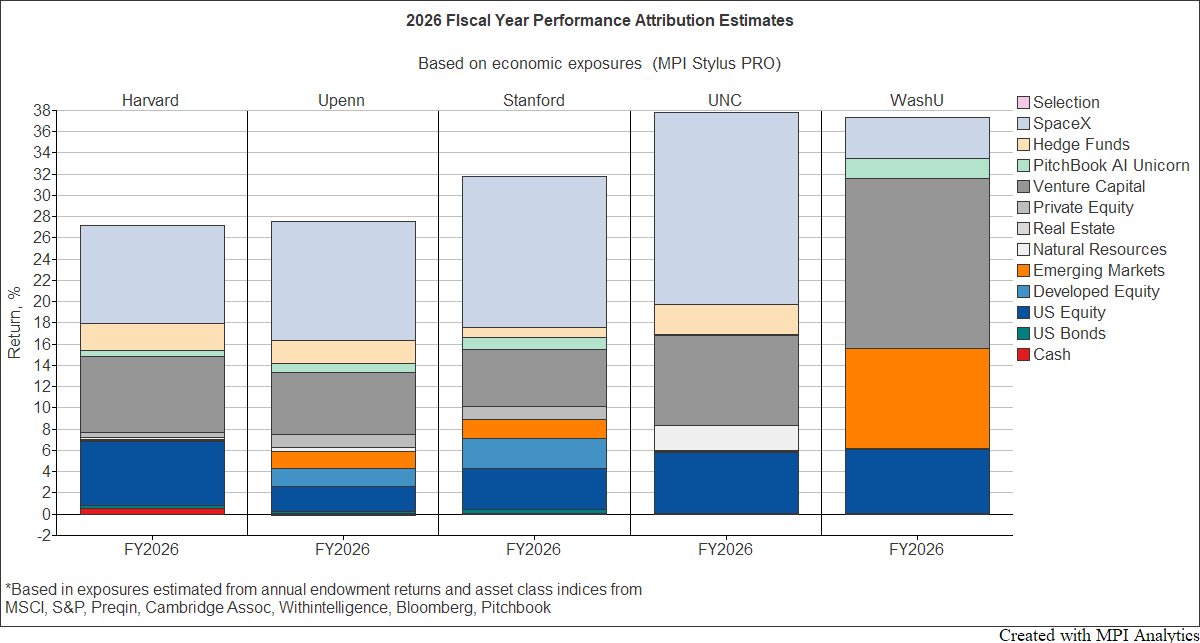
That smaller SpaceX estimate should not be read as contradicting the disclosed holding or measuring its full realized contribution. The model separates the part of return behavior associated with SpaceX from the behavior captured by the other factors. Some of the same gains may be reflected in the broader VC exposure, particularly when successful growth investments move together.
One plausible interpretation is that SpaceX sits alongside a broader group of successful venture, growth and co-investment positions. Reporting on WashU’s FY26 results also identifies gains from Cerebras and describes strength across venture and growth equity. This is consistent with the model’s broad VC signal, although it does not establish the contribution of any individual holding. The model also identifies a notable AI contribution, with the PitchBook AI Unicorn factor adding approximately 2 percentage points to the estimated FY26 attribution.
There is also a relevant development beyond the annual return series. In the October 22 Student Life interview, Wilson said that WashU had hedged some of its SpaceX position since the IPO and intended to reduce it over time. The disclosure does not establish how much any hedge affected FY26 returns, but it reinforces the distinction between a holding’s market value and its effective economic exposure.
A portfolio can hold several successful companies and still depend heavily on the same economic conditions. WashU’s results suggest that the concentration extends beyond any one investment to the venture and equity risks shared across the portfolio. The small separate SpaceX estimate therefore provides no basis for concluding that single-company risk is low.
The variation in annual returns makes the broader risk visible. Over the ten years through FY26, WashU’s standard deviation was 21.4%, almost twice Harvard’s 10.8%. This is not simply a consequence of the latest strong year: the corresponding ten-year figures through FY25 were 20.6% and 10.0%.
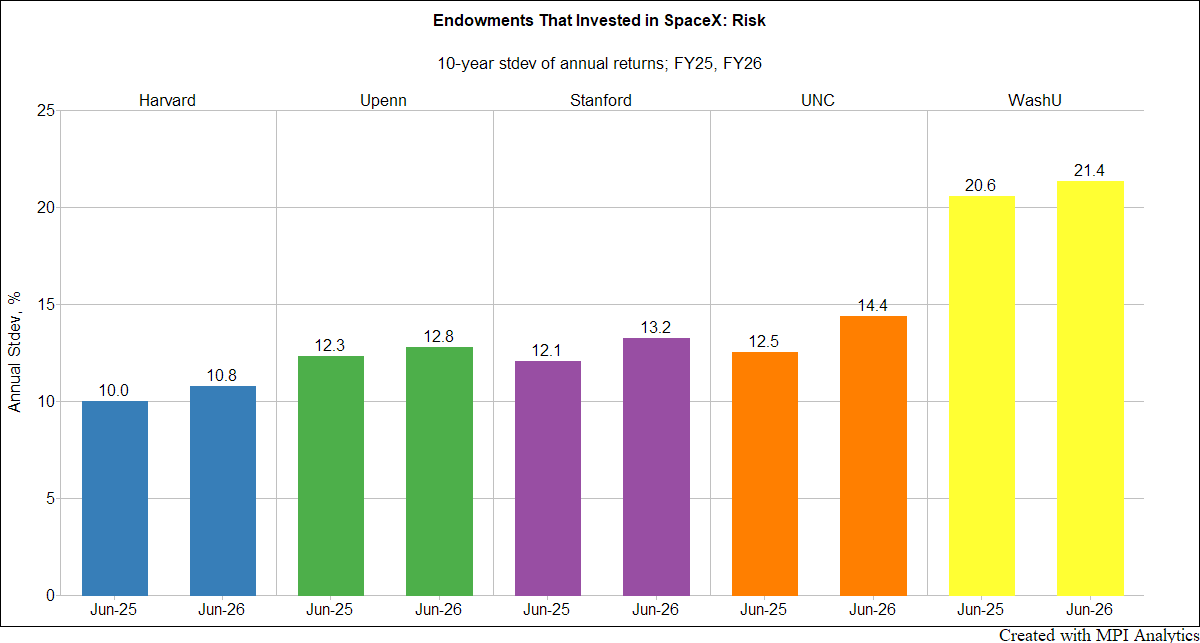
Annual observations offer a useful comparison, but ten data points cannot fully describe portfolio risk. Annual aggregation may reduce some effects of valuation smoothing, while leaving meaningful uncertainty about volatility and losses within the year. Moreover, standard deviation captures unusually strong gains as well as declines; it is not itself a measure of downside risk.
The higher variability also changes the comparison of risk-adjusted performance. Over the ten years through FY26, WashU’s Sharpe ratio was 0.60, approximately 26% to 29% below the 0.81–0.85 range for the four peers. Its leading long-term return has come with substantially greater variation in annual results.
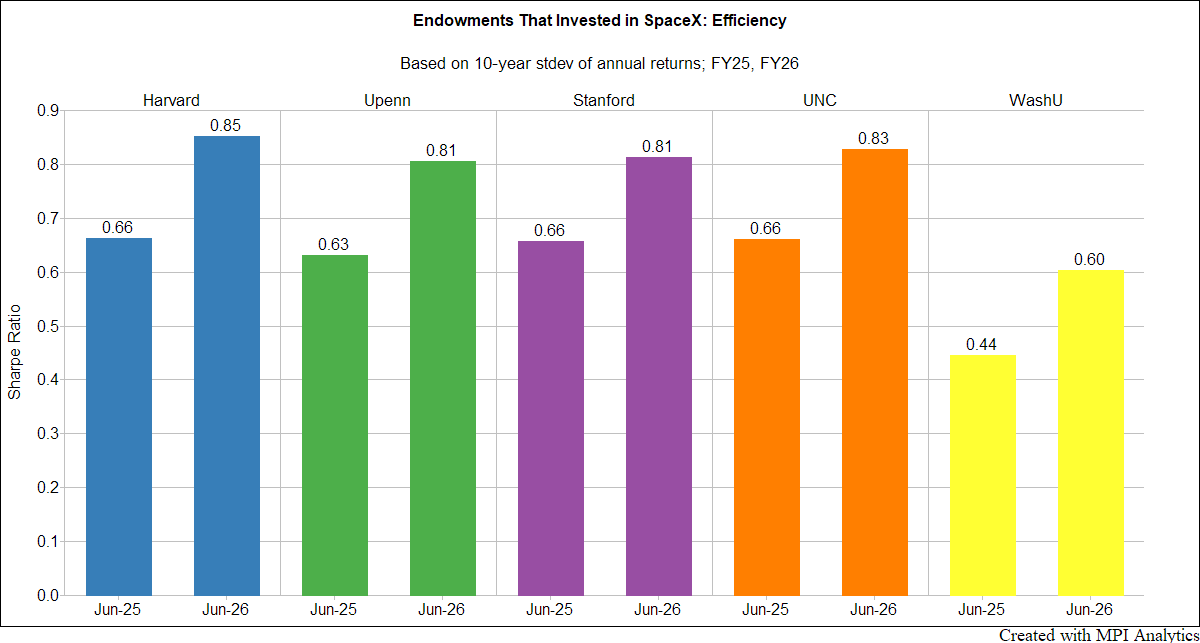
This comparison is a starting point for risk analysis, rather than a verdict on the investment process. It does not tell us whether WashU’s risk was appropriate for its objectives, or whether another endowment should have taken the same approach. Those judgments depend on the institution’s capacity to absorb losses while meeting spending needs and private investment commitments.
In the Transparency Lab, we also construct public-market proxies for private investment exposures to examine how a portfolio might behave under market stress. This allows us to look beyond the smoothness of reported private valuations and test the implications of the estimated economic exposures. A WashU-specific stress analysis would be needed before putting a number on its potential losses in a crisis.
WashU’s record deserves recognition, and its success appears to extend beyond a single winning investment. At the same time, the portfolio’s estimated economic exposures and the variability of its returns point to substantial concentration in venture capital and equity risk. For an investment committee, the relevant question is whether that concentration remains consistent with the university’s spending needs and tolerance for losses. An exceptional year is a good time to revisit that question, while the gains provide room to act.
Explore MPI’s individual board-level endowment reports, featuring Stylus PRO estimates of economic exposures and risk, along with stress tests and scenarios.
Method and sources
Using annual total-fund returns and asset-class factors, MPI estimates each portfolio’s economic sensitivities, with a separate SpaceX proxy derived from private-market share-price valuations and subsequent public-market prices. These estimates describe economic exposure rather than disclosed capital allocations, and both charts reflect the updated FY26 analysis. Stanford’s reported return covers its Merged Pool, while MIT’s covers its unitized pool of endowment and other funds; all ten-year figures end June 30, 2026. Please visit MPI Transparency Lab for more data and methodology.
Technology Solutions
Trusted by