FY2023 Ivy Report Card: Volatility Laundering and the Hangover from Private Markets Investing
Ivy and elite endowments did poorly in fiscal year 2023, especially relative to a global 70/30 benchmark and smaller, less resourced endowments that invest in less private markets assets/funds than those employing the ‘Yale model’.
FY2023 Report Takeaways:
- Ivy and elite endowments did poorly in fiscal year 2023 (+2.1%), especially relative to a global 70/30 benchmark (+11.1%) and smaller, less resourced endowments (+9%) that invest in less private markets assets/funds than those employing the ‘Yale model’.
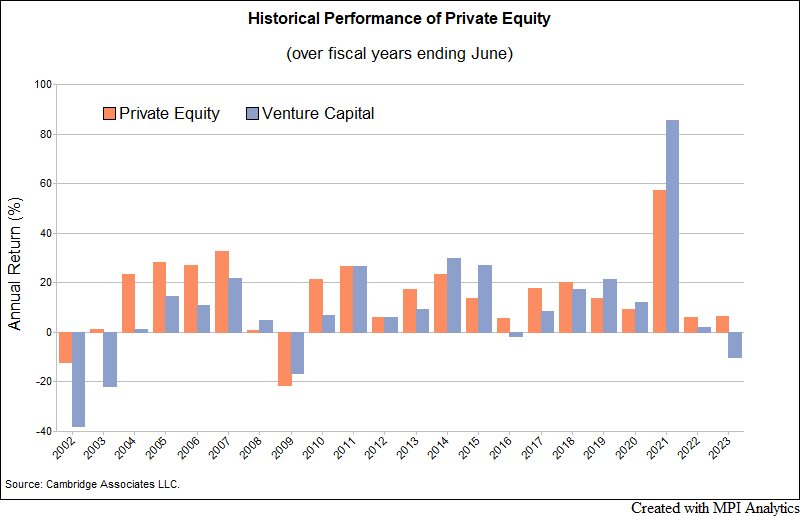
- Private Markets Dichotomy: FY2023 was the first year when private equity (PE) and venture capital (VC) noticeably moved in opposite directions (PE +6.1%; VC -10.2%) since FY 2003 when VC valuations continued to fall after the bursting of the Dot com bubble.
- Short-term drivers of Ivy and elite endowments: Allocations to VC on the downside and PE and public equity on the upside contributed significantly to elite endowment performance dispersion in FY2023.
- Longer-term drivers of performance = more risk. Over 10-yrs, Ivy and elite endowments show a very clear relationship between returns and risk-taking; simply put, these endowments appear to be levered versions of a global 70/30 portfolio. All schools exceed the 10-yr return of a global 70/30 (+6.8%), with the average Ivy returning 9.8%, but with significantly more risk. With a 12.6% standard deviation based on annual reported returns and an estimated 15.1% volatility based on Transparency Lab models, the average Ivy is projected to be almost 50% more volatile than the global 70/30 (10.71% volatility). The top performers over 10 years, MIT (+11.5% return, 21% modeled volatility) and Brown (+11.3%, 19.8% estimated standard deviation), show nearly double the risk of the benchmark. Yale appears to have the most efficient portfolio (14.3% standard deviation with a +10.9% return).
- Laundered risk is still risk: Despite the masking or laundering of volatility related to investing in private markets assets, which Ivy endowment CIOs state as a benefit of the Yale model, elite endowments are significantly riskier than a balanced portfolio invested in 70% stocks.
The Scorecard
Ivy endowments’ Fiscal Year 2023 numbers are in, and they are disappointing. This is especially so when compared with smaller, often less complex endowments and a global 70/30 stock/bond benchmark. The average Ivy League endowment return for the year ending June 30th, 2023 was a 2.1% gain. That compares to the average Ivy endowment loss of -2.4% in FY2022. The best-performing endowment, $13.6 billion Columbia University, gained 4.7%, while the worst-performing endowment, $34.1 billion Princeton, lost -1.7%, the only Ivy showing a loss for the fiscal year. And when including the largest elite non-Ivy cousins MIT and Stanford, the $23.5 billion MIT endowment reported an even deeper loss for FY2023, amounting to -2.9%, following a -5.3% loss in FY2022.
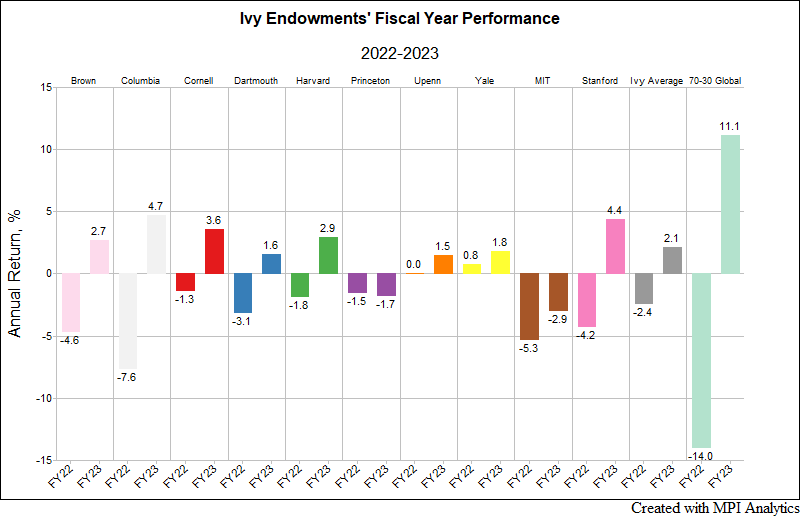
The average Ivy significantly underperformed the global 70/30, which gained 11.1% over the same period from July 2022 through June 2023. Smaller (less than $1 billion) endowments and foundations returned over 9% on average for the same period, while larger ones (more than $1 billion) returned slightly less than 8%, according to Wilshire TUCS. This represents a reversal from fiscal year 2022, when the elite large endowments significantly outperformed a global 70/30 and smaller endowments.
Through FY2023, the Brown University endowment has the highest 10-year annualized return among Ivies, 11.3%, which is slightly lower than MIT’s 11.5% 10-year return.
However, Brown also has the highest estimated risk of all Ivies (an estimated 19.8% annual standard deviation over the 10-yr period), and MIT’s endowment investment portfolio has an even higher modeled risk (21%), according to the MPI Transparency Lab. These volatility estimates are based on MPI’s proprietary calculations using quarterly proxy portfolios for the endowments, which are constructed to address staleness and smoothness of private investments. However, their risk estimates are also significantly higher than the global 70/30 benchmark’s when computed directly using the schools’ published annual endowment returns (15.5% and 17% annual standard deviation, respectively). The Transparency Lab’s risk-return diagram (shown below) is crucial for interpreting endowment results: higher longer-term returns appear to be associated with higher risk. This relationship is rarely highlighted in annual statements from endowment CIOs. Columbia and Harvard appear to have the lowest risk among Ivies (11.7% and 13.3% annual standard deviation estimates over 10-years, respectively), yet higher than that of the global 70/30 benchmark (10.7%).[1]
FY2023 Private Markets Dichotomy
As we projected back in May 2023, allocations to venture capital were the main drag for Ivy endowments, with private equity having low (albeit positive) returns, providing little offset. Over the period from July 2022 through June 2023, Cambridge Associates Venture Capital Index lost -10.2%. That compares to a 6.2% gain for the Cambridge Associates Private Equity Index. Notably, this not only comes in the very long shadow of 2021’s historic >80% return for VC, FY 2023 was the first fiscal year of meaningful losses for VCs since the 2008 Financial Crisis. It was also the first fiscal year when PE and VC performance significantly moved in opposite directions since FY2003 after the Dot-com bubble of the early 2000’s, as we see in the chart below (data from Cambridge Associates).
Please note that these numbers represent averages of hundreds of funds and the range of outcomes for individual funds is extremely wide. More VC markdowns are likely coming in FY2024, as Cambridge Associates’ VC Index recorded yet another negative quarter: -2.65% in Q3 2023 (ending Sept. 30th) by preliminary estimates.
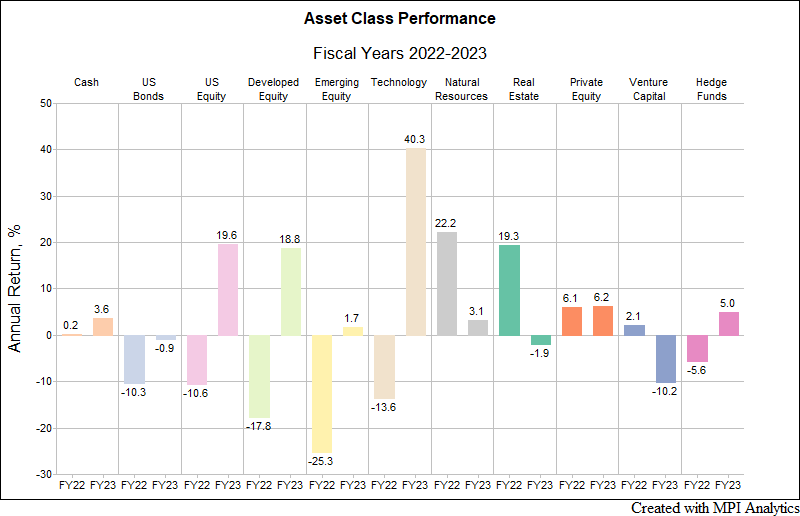
Balancing the negative return for VC, however, FY2023 was exceptional for public equities: over the same period, the S&P 500 Index rose 19.6%, while the S&P 500 Information Technology Index gained 40.3%.
Unlike most smaller endowments, the Ivies and other elite universities have significant allocations to non-public equity (PE and VC), within the 30-40% range, with few exceptions. But, as we see below, it is the split between PE and VC that has defined Ivy endowments’ results in FY2023, given their relatively low exposure to top-performing public equities.[2]
What Information is Missing in Annual Endowment Reports?
Breaking with tradition established under the late investing legend David Swensen, Yale’s new CIO Matthew Mendelsohn didn’t provide a quote for Yale endowment’s 2023 press release announcing its 1.8% fiscal year return. Though Mendelsohn did publish a letter reflecting on his first two years and his vision that noted the endowment’s commitment to private assets, there was precious little on the challenges from the period of rising rates that has marked FY 2022 and 2023. This may suggest that school staff, students, alumni and their surrounding communities are unlikely to receive much guidance nor accountability from other Ivy CIOs this year. Moreover, in an interview, Yale finance professor Matthew Spiegel even questioned the accuracy of Yale’s (or any of its peers’) reports due to the illiquid nature of investments.
However, the approach we pioneered in 2015 allows one to largely overcome the lack of transparency shading large opaque portfolios – that only report a single return per annum. Utilizing MPI’s quantitative Stylus Pro system, we use annual endowment returns to determine both the effective exposures of endowment portfolios to major common asset classes and their impact on the overall performance.[3] This information is unique because endowments rarely divulge much about their inner workings – and, when they do, it is – to say the least – challenging to verify the accuracy of their story.
The following chart from the MPI Transparency Lab provides an estimated breakdown of large endowments’ FY2023 total performance by asset class. In the chart below, each bar illustrates the components of the total return by asset class.[4] Note that venture capital (highlighted in light green) is the only asset class that had a significant negative impact on FY2023 performance. Endowments with significant exposure to public equities – whether directly or through hedge funds – and private equity outperformed ones with significant exposure to venture capital.
According to the above quantitative analysis, Brown, Dartmouth, and Princeton, together with MIT, have the highest exposure to venture capital – thus negatively affecting their performance in FY2023. But for MIT and Princeton, venture capital exposures overshadowed those of private equity, resulting in net negative performance. Brown, as we noted in our previous research, has significant exposure to public equities (tech-focused hedge funds in particular), which likely lifted their endowment out of negative territory.
What’s Not to Like in Book-Value Accounting?
When looking at asset class performance, one cannot help observing a roller coaster ride for both the global 70/30 benchmark and asset classes in fiscal years 2022-2023 – well summarized by the global 70/30’s -14% loss in FY2022 to an 11.1% gain in FY2023. PE and VC lack such dramatic swings though, primarily due to lagged and appraisal-based valuations. Critics suggest that such “volatility laundering” is one of the main reasons private markets are heavily allocated to by the Ivies and other elite endowments – but don’t take our word for it. Noting exceptional public equity performance in FY2023, Brown’s annual report says something remarkably honest:
“Why then would Brown’s endowment not pursue a highly liquid, high-returning, low-cost investment? One reason is because portfolios made up entirely of stocks tend to be highly volatile. Stock investors “earn” those high returns by enduring significant fluctuations in the value of their holdings. For an endowment with an annual payout, however, that volatility represents real risk.”
Harvard Management Company’s (HMC) 2023 annual letter conveys a similar message that their portfolio’s “limited long-only public equity exposure (11%)… helps brace against significant swings in either direction.”
Given that both Harvard’s and Brown’s allocation to non-public equity or private markets is about 40%[5], it is paradoxical how investing almost half of an institution’s portfolio in illiquid, levered (private equity buyout funds in particular) and somewhat speculative (venture capital) investments could improve annual payout prospects – especially in light of the segment’s recent cash flow challenges. The observed low volatility of PE is simply a product of lagged and stale valuations. By HMC’s own admission there is a “natural lag in how their assets are valued… Given the continued slowdown in exits and financing rounds over the last year, it will likely take more time for private valuations to fully reflect current market conditions.”
However, we could see how such “book-value accounting” of private assets dampens volatility and hides drawdowns from outside observers (e.g., boards, trusties, alumni, etc.), if that’s the goal. Stable value funds (SVF) are a good example of a similar approach, but stable value funds’ drawdowns are underwritten by large insurance companies. SVF fees are much higher than that of a typical money market fund because they include fees paid for the insurance wrapper that guarantees the stability of returns. Who is underwriting Ivy endowment drawdowns? All we know is that the stable returns of non-public / private equity are very expensive.
Laundered Risk Is Still Risk
Let’s not forget that private equity is still equity – actually it is levered equity for many buyout PEs. Further, VCs may appear as even more levered because of the optionality of early-stage investments. And once endowment portfolio risk is carefully extracted from their smooth annual track record, all Ivy endowments appear to be levered versions of the global 70/30 portfolio. The elite endowments are rather miraculously aligned along the “Ivies market line”[6] of the 10-year historical risk-return diagram of our Lab. The difference between the lowest-performing system, Columbia, and the best-performing, Brown (and MIT) would appear to be related to the level of risk the respective allocators are taking – it is that simple.
What Does the Future Hold for ‘The Yale Model’ in a New Regime?
As we attempt to put the Ivy endowments’ fiscal year 2023 in context, something Yale’s Mendelsohn wrote in his letter is worth pondering: “the Investments Office today finds itself in a market crowded with institutional investors, many of them employing similar investment strategies. Furthermore, we find ourselves at an economic inflection point, as a 40-year trend of declining interest rates reverses. And so, I have spent much of my first two years thinking through how to adapt ‘The Yale Model’ for a more competitive, more uncertain environment. One thing, though, is certain: success over the next four decades will look different than success over the last four.”
In terms of past success, Yale does have the highest estimated efficiency over 10-years amongst the large elite endowments – being the only endowment above the Ivies market line on the 10-year diagram. This makes Swensen’s legacy unique.
So, to rephrase Mendelsohn’s statement, we’d suggest asking: will Yale be able to maintain the same level of efficiency going forward – regardless of its risk level?
To answer that requires at least some understanding of the level of risk – something that we may never be able to find in endowment annual reports or CIOs’ letters. The Transparency Lab is designed to close this gap. Risk is an important factor when assessing results – regardless of whether it’s a horse race, poker or endowment portfolio. Laundering and/or disregarding risk information is a choice – but investors can only hide from it for so long. When public markets experience major corrections, as they did during the Global Financial Crisis of 2008, private assets inevitably are marked to market: in FY2009 Brown lost -23%, Yale fell by -24.6% and Harvard lost -27.3% compared to the -19% loss for the global 70/30 benchmark.
It will be interesting to see how long the hangover from falling private markets valuations continues to challenge elite endowments’ returns.
2023 provided a stark reminder of how difficult it can be to outsmart an inexpensive, liquid balanced portfolio (the global 70/30). To what extent will the smaller and less resourced endowments (or more accountable public systems), the Davids that outperformed the proverbial Goliaths in FY2023, cease chasing the elite universities into private markets and growing allocations to PE, VC, private credit and hedge funds? If that happened, it could serve to both decrease competition for the Ivies and demand for private markets investments.
We won’t hold our breath for that, but we’ll certainly be monitoring how the large elite endowments adapt for the uncertain environment ahead.
_____________________________
[1] If computed using quarterly returns as we do when estimating endowment volatility using market proxies.
[2] As compared to smaller and more traditional endowment portfolios. For example, Harvard’s and Brown’s public equity allocations are 11% and 16% respectively.
[3] Disclaimer: Some statistics on this page are based on exposure estimates obtained through quantitative analysis and, beyond any public information, MPI does not claim to know or insinuate what the actual strategy, positions or holdings of the funds are, nor are we commenting on the quality or merits of the strategies. Deviations between our analysis and the actual holdings and/or management decisions made by funds are expected and inherent in any quantitative analysis. MPI makes no warranties or guarantees as to the accuracy of this statistical analysis, nor does it take any responsibility for investment decisions made by any parties based on this analysis.
[4] For each endowment (and the 70-30 benchmark) the sum of all stacked bars is equal to its total return for the year
[5] In endowment reports this allocation typically includes venture capital.
[6] To paraphrase the textbook “securities market line”.
Very insightful observations and comments. Well done. Thanks for sharing this information.
Bob – thank you very much! Please make sure to visit our Transparency Lab for more insights and individual endowment reports https://www.markovprocesses.com/product/mpi-transparency-lab/
Timely research! Would love to learn more about measuring risk in Private Equity
Hi Ning, thanks for your feedback! PE risk = market/leverage + sector focus/timing + staleness premium (expected markdowns due to valuation inertia). We should be able to help. -Michael